Immigrants from Germany vs Trinidadian and Tobagonian Births to Unmarried Women
COMPARE
Immigrants from Germany
Trinidadian and Tobagonian
Births to Unmarried Women
Births to Unmarried Women Comparison
Immigrants from Germany
Trinidadians and Tobagonians
32.8%
BIRTHS TO UNMARRIED WOMEN
18.8/ 100
METRIC RATING
200th/ 347
METRIC RANK
36.5%
BIRTHS TO UNMARRIED WOMEN
0.2/ 100
METRIC RATING
261st/ 347
METRIC RANK
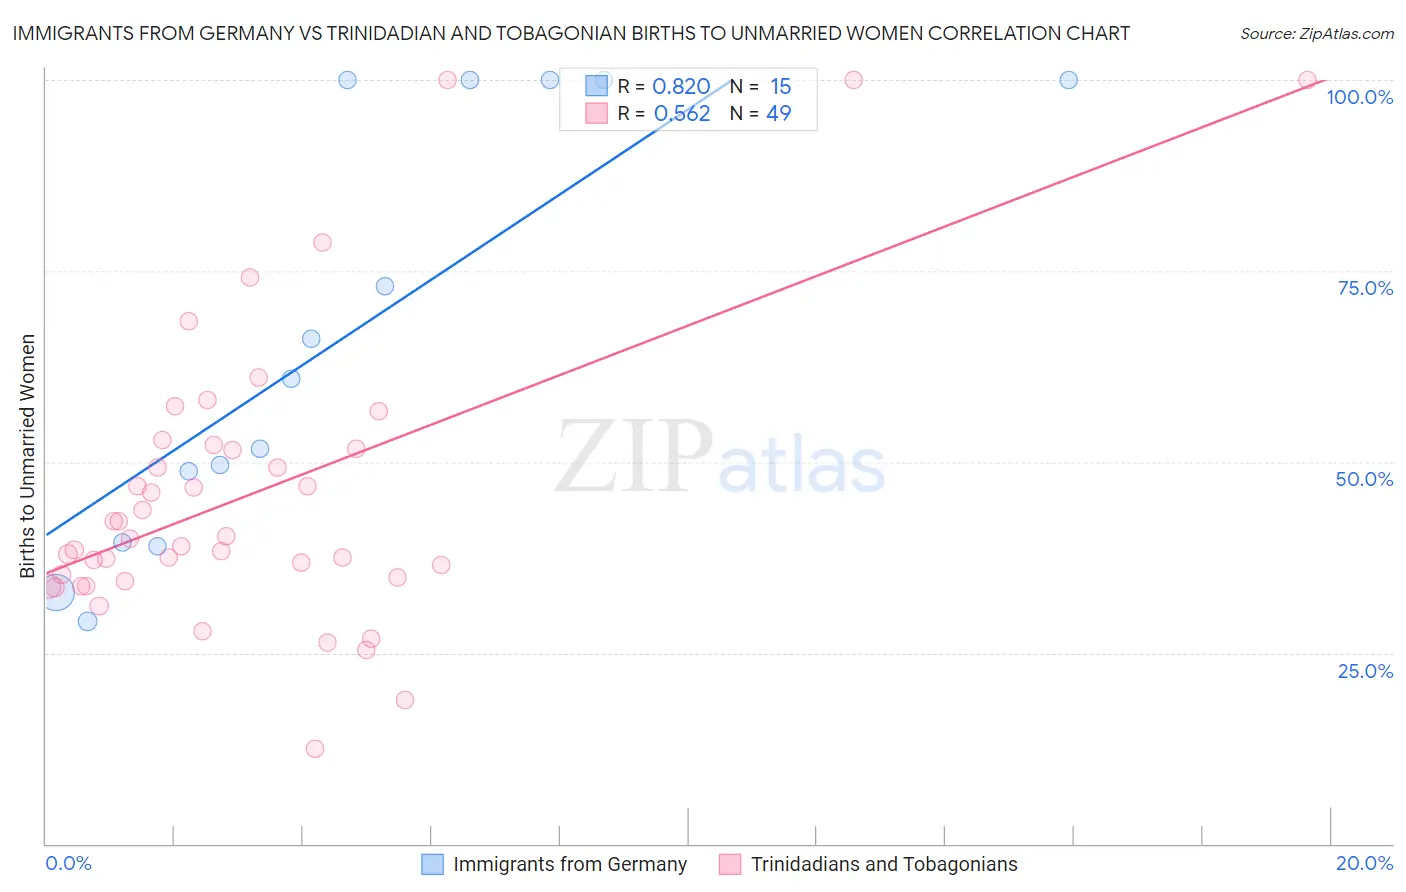
Immigrants from Germany vs Trinidadian and Tobagonian Births to Unmarried Women Correlation Chart
The statistical analysis conducted on geographies consisting of 426,659,572 people shows a very strong positive correlation between the proportion of Immigrants from Germany and percentage of births to unmarried women in the United States with a correlation coefficient (R) of 0.820 and weighted average of 32.8%. Similarly, the statistical analysis conducted on geographies consisting of 212,407,546 people shows a substantial positive correlation between the proportion of Trinidadians and Tobagonians and percentage of births to unmarried women in the United States with a correlation coefficient (R) of 0.562 and weighted average of 36.5%, a difference of 11.3%.
Births to Unmarried Women Correlation Summary
| Measurement | Immigrants from Germany | Trinidadian and Tobagonian |
| Minimum | 29.1% | 12.5% |
| Maximum | 100.0% | 100.0% |
| Range | 70.9% | 87.5% |
| Mean | 66.0% | 45.7% |
| Median | 60.8% | 39.9% |
| Interquartile 25% (IQ1) | 39.5% | 34.6% |
| Interquartile 75% (IQ3) | 100.0% | 52.0% |
| Interquartile Range (IQR) | 60.5% | 17.4% |
| Standard Deviation (Sample) | 27.4% | 19.0% |
| Standard Deviation (Population) | 26.5% | 18.8% |
Similar Demographics by Births to Unmarried Women
Demographics Similar to Immigrants from Germany by Births to Unmarried Women
In terms of births to unmarried women, the demographic groups most similar to Immigrants from Germany are Immigrants from Thailand (32.8%, a difference of 0.010%), Costa Rican (32.7%, a difference of 0.22%), Immigrants (32.7%, a difference of 0.26%), Immigrants from Burma/Myanmar (32.9%, a difference of 0.33%), and Immigrants from Micronesia (32.9%, a difference of 0.34%).
| Demographics | Rating | Rank | Births to Unmarried Women |
| Fijians | 31.1 /100 | #193 | Fair 32.3% |
| Sudanese | 27.3 /100 | #194 | Fair 32.4% |
| Samoans | 21.9 /100 | #195 | Fair 32.6% |
| Immigrants | Colombia | 21.7 /100 | #196 | Fair 32.6% |
| Immigrants | Immigrants | 20.6 /100 | #197 | Fair 32.7% |
| Costa Ricans | 20.3 /100 | #198 | Fair 32.7% |
| Immigrants | Thailand | 18.9 /100 | #199 | Poor 32.8% |
| Immigrants | Germany | 18.8 /100 | #200 | Poor 32.8% |
| Immigrants | Burma/Myanmar | 16.7 /100 | #201 | Poor 32.9% |
| Immigrants | Micronesia | 16.6 /100 | #202 | Poor 32.9% |
| Ute | 14.4 /100 | #203 | Poor 33.0% |
| Immigrants | Africa | 14.3 /100 | #204 | Poor 33.0% |
| German Russians | 13.1 /100 | #205 | Poor 33.1% |
| Uruguayans | 12.8 /100 | #206 | Poor 33.1% |
| Immigrants | Sudan | 11.5 /100 | #207 | Poor 33.2% |
Demographics Similar to Trinidadians and Tobagonians by Births to Unmarried Women
In terms of births to unmarried women, the demographic groups most similar to Trinidadians and Tobagonians are Ottawa (36.5%, a difference of 0.0%), Immigrants from El Salvador (36.4%, a difference of 0.12%), American (36.4%, a difference of 0.17%), French American Indian (36.6%, a difference of 0.37%), and Nicaraguan (36.6%, a difference of 0.38%).
| Demographics | Rating | Rank | Births to Unmarried Women |
| Potawatomi | 0.2 /100 | #254 | Tragic 36.2% |
| Chickasaw | 0.2 /100 | #255 | Tragic 36.3% |
| Immigrants | Trinidad and Tobago | 0.2 /100 | #256 | Tragic 36.3% |
| Immigrants | Grenada | 0.2 /100 | #257 | Tragic 36.3% |
| Americans | 0.2 /100 | #258 | Tragic 36.4% |
| Immigrants | El Salvador | 0.2 /100 | #259 | Tragic 36.4% |
| Ottawa | 0.2 /100 | #260 | Tragic 36.5% |
| Trinidadians and Tobagonians | 0.2 /100 | #261 | Tragic 36.5% |
| French American Indians | 0.1 /100 | #262 | Tragic 36.6% |
| Nicaraguans | 0.1 /100 | #263 | Tragic 36.6% |
| Sub-Saharan Africans | 0.1 /100 | #264 | Tragic 36.7% |
| Cherokee | 0.1 /100 | #265 | Tragic 36.7% |
| Immigrants | Senegal | 0.1 /100 | #266 | Tragic 36.7% |
| Central Americans | 0.1 /100 | #267 | Tragic 36.7% |
| Comanche | 0.1 /100 | #268 | Tragic 36.7% |