Immigrants from Bulgaria vs Jamaican Divorced or Separated
COMPARE
Immigrants from Bulgaria
Jamaican
Divorced or Separated
Divorced or Separated Comparison
Immigrants from Bulgaria
Jamaicans
11.5%
DIVORCED OR SEPARATED
99.3/ 100
METRIC RATING
83rd/ 347
METRIC RANK
12.9%
DIVORCED OR SEPARATED
0.0/ 100
METRIC RATING
293rd/ 347
METRIC RANK
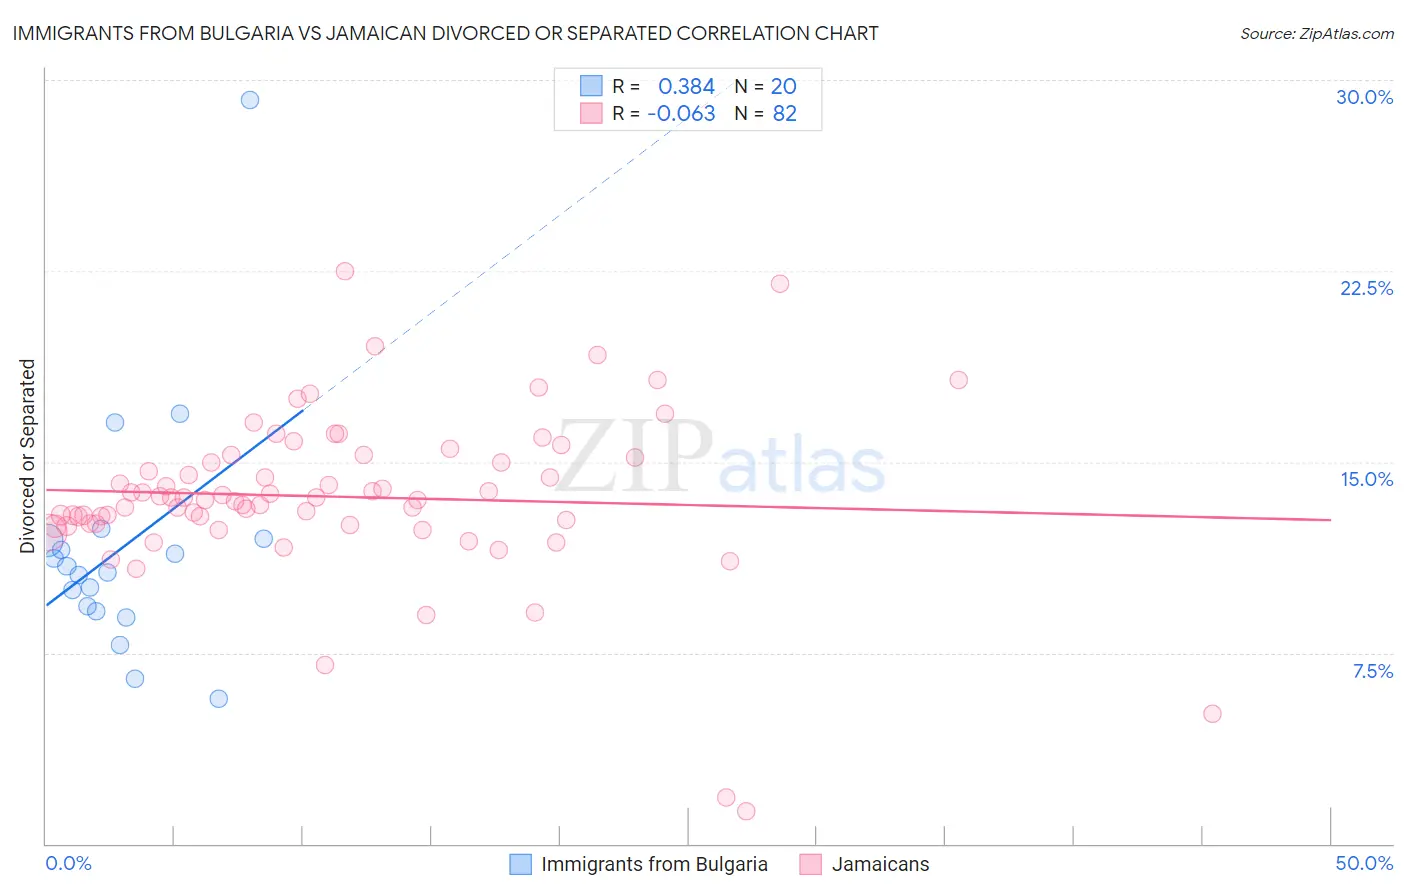
Immigrants from Bulgaria vs Jamaican Divorced or Separated Correlation Chart
The statistical analysis conducted on geographies consisting of 172,542,823 people shows a mild positive correlation between the proportion of Immigrants from Bulgaria and percentage of population currently divorced or separated in the United States with a correlation coefficient (R) of 0.384 and weighted average of 11.5%. Similarly, the statistical analysis conducted on geographies consisting of 367,802,354 people shows a slight negative correlation between the proportion of Jamaicans and percentage of population currently divorced or separated in the United States with a correlation coefficient (R) of -0.063 and weighted average of 12.9%, a difference of 12.1%.
Divorced or Separated Correlation Summary
| Measurement | Immigrants from Bulgaria | Jamaican |
| Minimum | 5.7% | 1.3% |
| Maximum | 29.2% | 22.5% |
| Range | 23.5% | 21.2% |
| Mean | 11.6% | 13.6% |
| Median | 10.8% | 13.5% |
| Interquartile 25% (IQ1) | 9.2% | 12.6% |
| Interquartile 75% (IQ3) | 12.0% | 15.2% |
| Interquartile Range (IQR) | 2.7% | 2.6% |
| Standard Deviation (Sample) | 4.9% | 3.3% |
| Standard Deviation (Population) | 4.8% | 3.3% |
Similar Demographics by Divorced or Separated
Demographics Similar to Immigrants from Bulgaria by Divorced or Separated
In terms of divorced or separated, the demographic groups most similar to Immigrants from Bulgaria are Bulgarian (11.5%, a difference of 0.020%), Immigrants from Romania (11.5%, a difference of 0.030%), Immigrants from Albania (11.5%, a difference of 0.080%), Russian (11.5%, a difference of 0.11%), and Immigrants from Switzerland (11.5%, a difference of 0.12%).
| Demographics | Rating | Rank | Divorced or Separated |
| Albanians | 99.6 /100 | #76 | Exceptional 11.5% |
| Immigrants | Italy | 99.5 /100 | #77 | Exceptional 11.5% |
| Afghans | 99.4 /100 | #78 | Exceptional 11.5% |
| Guyanese | 99.4 /100 | #79 | Exceptional 11.5% |
| Immigrants | Switzerland | 99.4 /100 | #80 | Exceptional 11.5% |
| Russians | 99.4 /100 | #81 | Exceptional 11.5% |
| Immigrants | Romania | 99.3 /100 | #82 | Exceptional 11.5% |
| Immigrants | Bulgaria | 99.3 /100 | #83 | Exceptional 11.5% |
| Bulgarians | 99.3 /100 | #84 | Exceptional 11.5% |
| Immigrants | Albania | 99.3 /100 | #85 | Exceptional 11.5% |
| Immigrants | Latvia | 99.2 /100 | #86 | Exceptional 11.6% |
| Immigrants | Nepal | 99.2 /100 | #87 | Exceptional 11.6% |
| Immigrants | Europe | 99.2 /100 | #88 | Exceptional 11.6% |
| Immigrants | Southern Europe | 99.1 /100 | #89 | Exceptional 11.6% |
| Zimbabweans | 99.0 /100 | #90 | Exceptional 11.6% |
Demographics Similar to Jamaicans by Divorced or Separated
In terms of divorced or separated, the demographic groups most similar to Jamaicans are Apache (12.9%, a difference of 0.030%), Celtic (13.0%, a difference of 0.16%), Scotch-Irish (12.9%, a difference of 0.21%), Immigrants from Honduras (12.9%, a difference of 0.27%), and Pima (12.9%, a difference of 0.38%).
| Demographics | Rating | Rank | Divorced or Separated |
| Spanish | 0.1 /100 | #286 | Tragic 12.8% |
| Hondurans | 0.1 /100 | #287 | Tragic 12.8% |
| French Canadians | 0.1 /100 | #288 | Tragic 12.8% |
| Iroquois | 0.0 /100 | #289 | Tragic 12.9% |
| Pima | 0.0 /100 | #290 | Tragic 12.9% |
| Immigrants | Honduras | 0.0 /100 | #291 | Tragic 12.9% |
| Scotch-Irish | 0.0 /100 | #292 | Tragic 12.9% |
| Jamaicans | 0.0 /100 | #293 | Tragic 12.9% |
| Apache | 0.0 /100 | #294 | Tragic 12.9% |
| Celtics | 0.0 /100 | #295 | Tragic 13.0% |
| Nicaraguans | 0.0 /100 | #296 | Tragic 13.0% |
| Natives/Alaskans | 0.0 /100 | #297 | Tragic 13.0% |
| Venezuelans | 0.0 /100 | #298 | Tragic 13.0% |
| Immigrants | Jamaica | 0.0 /100 | #299 | Tragic 13.0% |
| Immigrants | Cabo Verde | 0.0 /100 | #300 | Tragic 13.1% |