Immigrants from Eastern Africa vs Finnish Family Households with Children
COMPARE
Immigrants from Eastern Africa
Finnish
Family Households with Children
Family Households with Children Comparison
Immigrants from Eastern Africa
Finns
27.7%
FAMILY HOUSEHOLDS WITH CHILDREN
80.2/ 100
METRIC RATING
143rd/ 347
METRIC RANK
26.6%
FAMILY HOUSEHOLDS WITH CHILDREN
0.4/ 100
METRIC RATING
279th/ 347
METRIC RANK
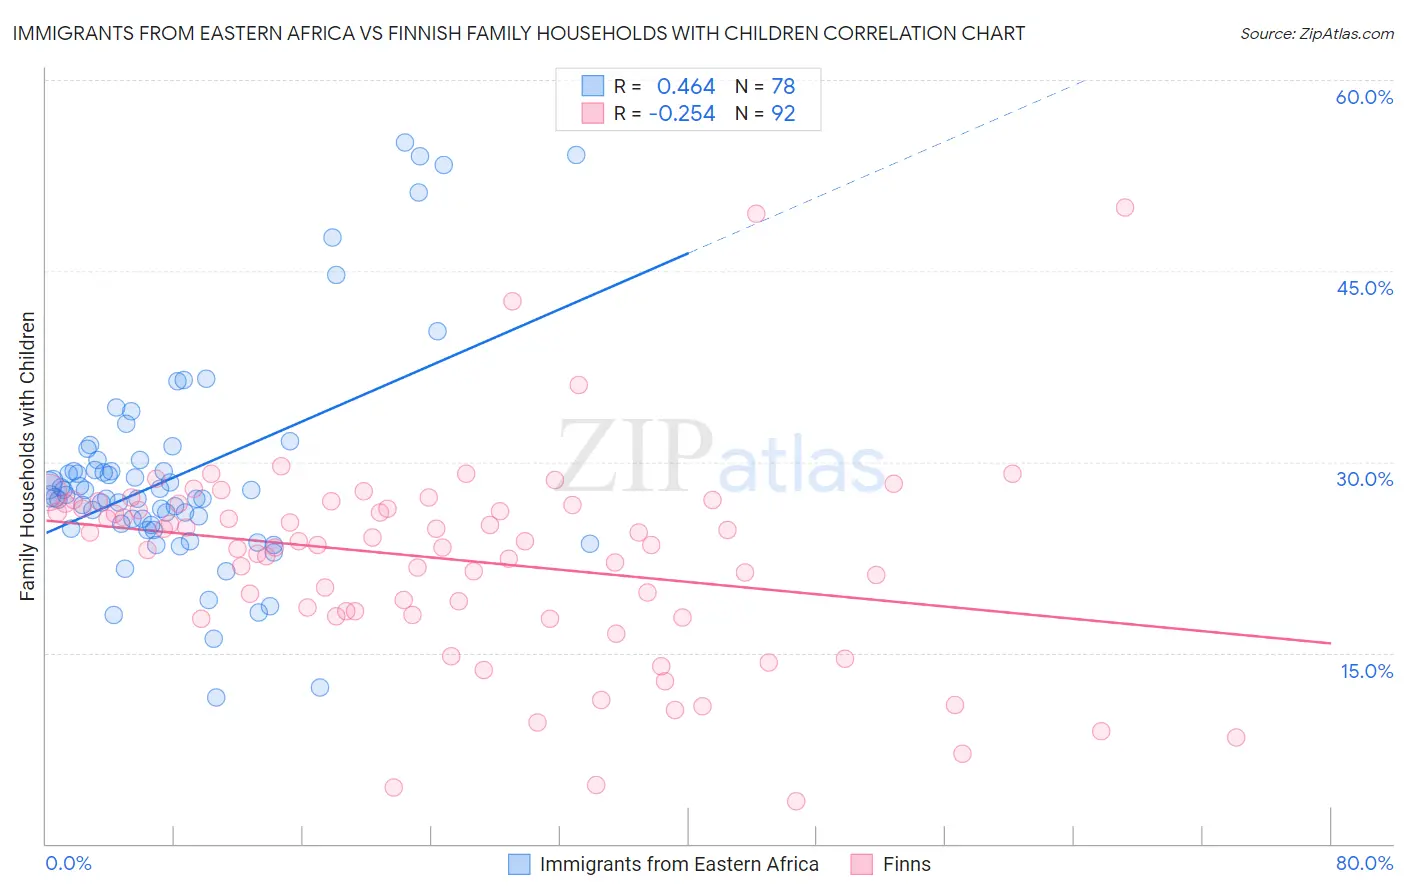
Immigrants from Eastern Africa vs Finnish Family Households with Children Correlation Chart
The statistical analysis conducted on geographies consisting of 354,810,617 people shows a moderate positive correlation between the proportion of Immigrants from Eastern Africa and percentage of family households with children in the United States with a correlation coefficient (R) of 0.464 and weighted average of 27.7%. Similarly, the statistical analysis conducted on geographies consisting of 404,347,048 people shows a weak negative correlation between the proportion of Finns and percentage of family households with children in the United States with a correlation coefficient (R) of -0.254 and weighted average of 26.6%, a difference of 4.0%.
Family Households with Children Correlation Summary
| Measurement | Immigrants from Eastern Africa | Finnish |
| Minimum | 11.5% | 3.3% |
| Maximum | 55.1% | 50.0% |
| Range | 43.6% | 46.7% |
| Mean | 29.0% | 22.4% |
| Median | 27.3% | 23.6% |
| Interquartile 25% (IQ1) | 25.0% | 18.1% |
| Interquartile 75% (IQ3) | 30.1% | 26.7% |
| Interquartile Range (IQR) | 5.1% | 8.6% |
| Standard Deviation (Sample) | 8.6% | 8.0% |
| Standard Deviation (Population) | 8.6% | 8.0% |
Similar Demographics by Family Households with Children
Demographics Similar to Immigrants from Eastern Africa by Family Households with Children
In terms of family households with children, the demographic groups most similar to Immigrants from Eastern Africa are Brazilian (27.7%, a difference of 0.020%), Immigrants from Chile (27.7%, a difference of 0.030%), Basque (27.7%, a difference of 0.030%), Swiss (27.7%, a difference of 0.040%), and Immigrants from Moldova (27.6%, a difference of 0.040%).
| Demographics | Rating | Rank | Family Households with Children |
| Immigrants | Portugal | 84.1 /100 | #136 | Excellent 27.7% |
| Immigrants | Dominican Republic | 83.9 /100 | #137 | Excellent 27.7% |
| Uruguayans | 83.2 /100 | #138 | Excellent 27.7% |
| Vietnamese | 82.6 /100 | #139 | Excellent 27.7% |
| Spanish | 81.8 /100 | #140 | Excellent 27.7% |
| Immigrants | Eastern Asia | 81.7 /100 | #141 | Excellent 27.7% |
| Swiss | 81.4 /100 | #142 | Excellent 27.7% |
| Immigrants | Eastern Africa | 80.2 /100 | #143 | Excellent 27.7% |
| Brazilians | 79.6 /100 | #144 | Good 27.7% |
| Immigrants | Chile | 79.5 /100 | #145 | Good 27.7% |
| Basques | 79.5 /100 | #146 | Good 27.7% |
| Immigrants | Moldova | 79.1 /100 | #147 | Good 27.6% |
| Osage | 79.0 /100 | #148 | Good 27.6% |
| Menominee | 78.9 /100 | #149 | Good 27.6% |
| Argentineans | 78.5 /100 | #150 | Good 27.6% |
Demographics Similar to Finns by Family Households with Children
In terms of family households with children, the demographic groups most similar to Finns are Immigrants from Europe (26.6%, a difference of 0.020%), Senegalese (26.6%, a difference of 0.020%), Celtic (26.6%, a difference of 0.080%), Lithuanian (26.6%, a difference of 0.12%), and French American Indian (26.6%, a difference of 0.13%).
| Demographics | Rating | Rank | Family Households with Children |
| Somalis | 0.7 /100 | #272 | Tragic 26.7% |
| Immigrants | Hungary | 0.6 /100 | #273 | Tragic 26.7% |
| Eastern Europeans | 0.6 /100 | #274 | Tragic 26.7% |
| Immigrants | Northern Europe | 0.5 /100 | #275 | Tragic 26.7% |
| Immigrants | Spain | 0.5 /100 | #276 | Tragic 26.6% |
| Celtics | 0.4 /100 | #277 | Tragic 26.6% |
| Immigrants | Europe | 0.4 /100 | #278 | Tragic 26.6% |
| Finns | 0.4 /100 | #279 | Tragic 26.6% |
| Senegalese | 0.4 /100 | #280 | Tragic 26.6% |
| Lithuanians | 0.3 /100 | #281 | Tragic 26.6% |
| French American Indians | 0.3 /100 | #282 | Tragic 26.6% |
| Immigrants | North America | 0.3 /100 | #283 | Tragic 26.6% |
| Immigrants | Canada | 0.3 /100 | #284 | Tragic 26.5% |
| Cambodians | 0.2 /100 | #285 | Tragic 26.5% |
| Immigrants | Senegal | 0.2 /100 | #286 | Tragic 26.5% |