Macedonian vs Basque Single Mother Households
COMPARE
Macedonian
Basque
Single Mother Households
Single Mother Households Comparison
Macedonians
Basques
5.4%
SINGLE MOTHER HOUSEHOLDS
99.5/ 100
METRIC RATING
42nd/ 347
METRIC RANK
5.7%
SINGLE MOTHER HOUSEHOLDS
96.7/ 100
METRIC RATING
94th/ 347
METRIC RANK
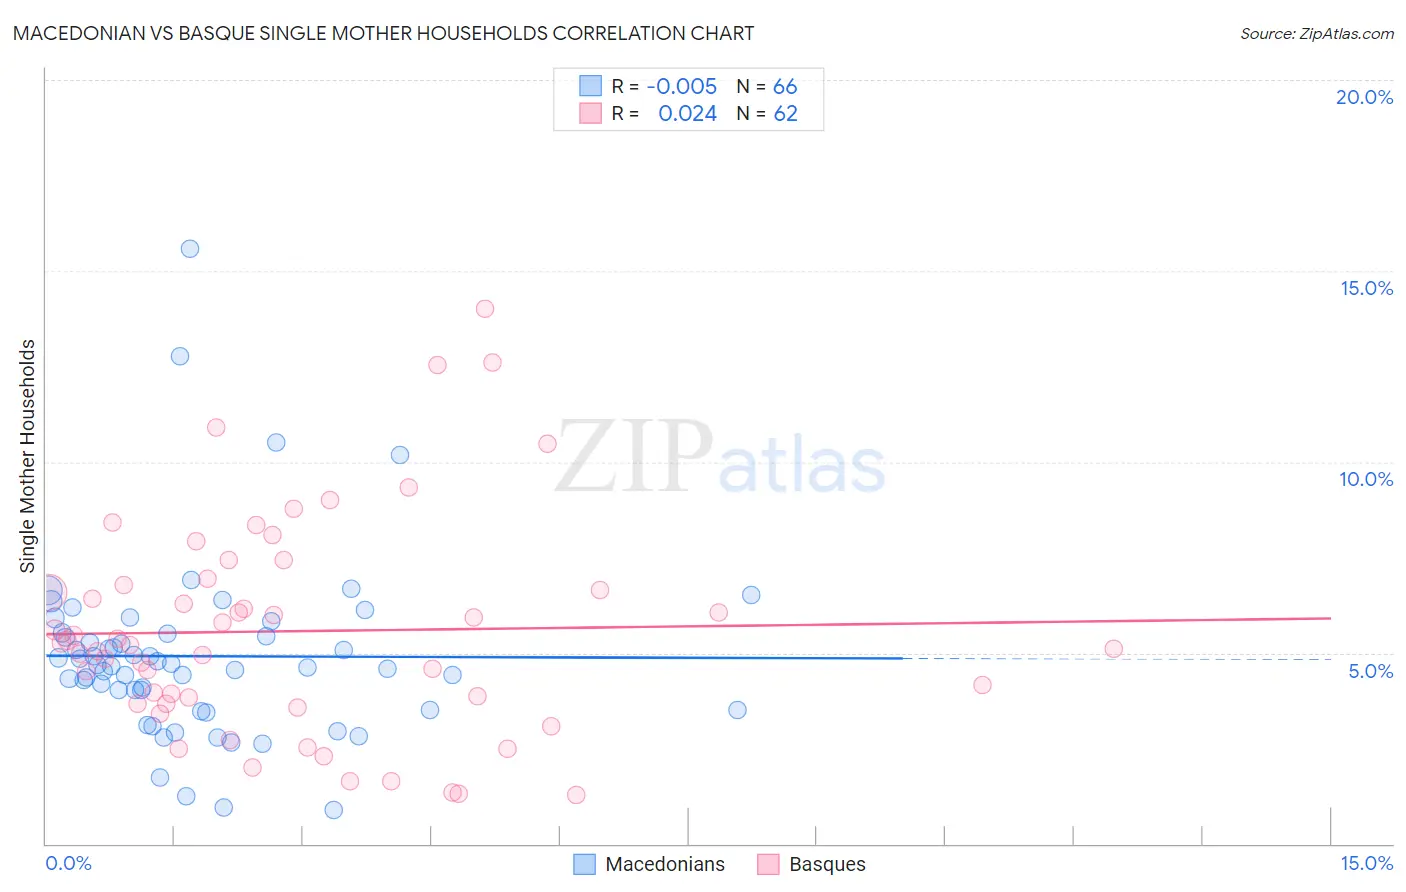
Macedonian vs Basque Single Mother Households Correlation Chart
The statistical analysis conducted on geographies consisting of 132,446,504 people shows no correlation between the proportion of Macedonians and percentage of single mother households in the United States with a correlation coefficient (R) of -0.005 and weighted average of 5.4%. Similarly, the statistical analysis conducted on geographies consisting of 165,555,400 people shows no correlation between the proportion of Basques and percentage of single mother households in the United States with a correlation coefficient (R) of 0.024 and weighted average of 5.7%, a difference of 6.2%.
Single Mother Households Correlation Summary
| Measurement | Macedonian | Basque |
| Minimum | 0.89% | 1.3% |
| Maximum | 15.6% | 14.0% |
| Range | 14.7% | 12.7% |
| Mean | 4.9% | 5.6% |
| Median | 4.7% | 5.2% |
| Interquartile 25% (IQ1) | 3.5% | 3.7% |
| Interquartile 75% (IQ3) | 5.5% | 6.8% |
| Interquartile Range (IQR) | 2.0% | 3.1% |
| Standard Deviation (Sample) | 2.4% | 2.8% |
| Standard Deviation (Population) | 2.4% | 2.8% |
Similar Demographics by Single Mother Households
Demographics Similar to Macedonians by Single Mother Households
In terms of single mother households, the demographic groups most similar to Macedonians are Immigrants from South Central Asia (5.4%, a difference of 0.060%), Immigrants from Greece (5.4%, a difference of 0.080%), Estonian (5.4%, a difference of 0.50%), Immigrants from Sweden (5.4%, a difference of 0.61%), and Immigrants from Serbia (5.4%, a difference of 0.76%).
| Demographics | Rating | Rank | Single Mother Households |
| Immigrants | Northern Europe | 99.7 /100 | #35 | Exceptional 5.3% |
| Immigrants | Czechoslovakia | 99.7 /100 | #36 | Exceptional 5.3% |
| Immigrants | Belgium | 99.7 /100 | #37 | Exceptional 5.3% |
| Immigrants | Serbia | 99.6 /100 | #38 | Exceptional 5.4% |
| Immigrants | Sweden | 99.6 /100 | #39 | Exceptional 5.4% |
| Estonians | 99.6 /100 | #40 | Exceptional 5.4% |
| Immigrants | Greece | 99.5 /100 | #41 | Exceptional 5.4% |
| Macedonians | 99.5 /100 | #42 | Exceptional 5.4% |
| Immigrants | South Central Asia | 99.5 /100 | #43 | Exceptional 5.4% |
| Lithuanians | 99.4 /100 | #44 | Exceptional 5.4% |
| Immigrants | Croatia | 99.4 /100 | #45 | Exceptional 5.4% |
| Croatians | 99.3 /100 | #46 | Exceptional 5.5% |
| Norwegians | 99.3 /100 | #47 | Exceptional 5.5% |
| Turks | 99.2 /100 | #48 | Exceptional 5.5% |
| Immigrants | Latvia | 99.2 /100 | #49 | Exceptional 5.5% |
Demographics Similar to Basques by Single Mother Households
In terms of single mother households, the demographic groups most similar to Basques are Serbian (5.7%, a difference of 0.050%), Immigrants from Western Asia (5.7%, a difference of 0.060%), Slovak (5.7%, a difference of 0.060%), Austrian (5.7%, a difference of 0.21%), and Tlingit-Haida (5.7%, a difference of 0.26%).
| Demographics | Rating | Rank | Single Mother Households |
| Immigrants | Turkey | 97.5 /100 | #87 | Exceptional 5.7% |
| Israelis | 97.4 /100 | #88 | Exceptional 5.7% |
| Ukrainians | 97.2 /100 | #89 | Exceptional 5.7% |
| Immigrants | Indonesia | 97.2 /100 | #90 | Exceptional 5.7% |
| Europeans | 97.0 /100 | #91 | Exceptional 5.7% |
| Immigrants | Western Asia | 96.7 /100 | #92 | Exceptional 5.7% |
| Serbians | 96.7 /100 | #93 | Exceptional 5.7% |
| Basques | 96.7 /100 | #94 | Exceptional 5.7% |
| Slovaks | 96.6 /100 | #95 | Exceptional 5.7% |
| Austrians | 96.4 /100 | #96 | Exceptional 5.7% |
| Tlingit-Haida | 96.4 /100 | #97 | Exceptional 5.7% |
| Immigrants | South Africa | 96.3 /100 | #98 | Exceptional 5.7% |
| Immigrants | Poland | 96.3 /100 | #99 | Exceptional 5.8% |
| Scandinavians | 96.2 /100 | #100 | Exceptional 5.8% |
| Germans | 96.2 /100 | #101 | Exceptional 5.8% |