Immigrants from Cuba vs Celtic Family Households with Children
COMPARE
Immigrants from Cuba
Celtic
Family Households with Children
Family Households with Children Comparison
Immigrants from Cuba
Celtics
26.8%
FAMILY HOUSEHOLDS WITH CHILDREN
1.3/ 100
METRIC RATING
258th/ 347
METRIC RANK
26.6%
FAMILY HOUSEHOLDS WITH CHILDREN
0.4/ 100
METRIC RATING
277th/ 347
METRIC RANK
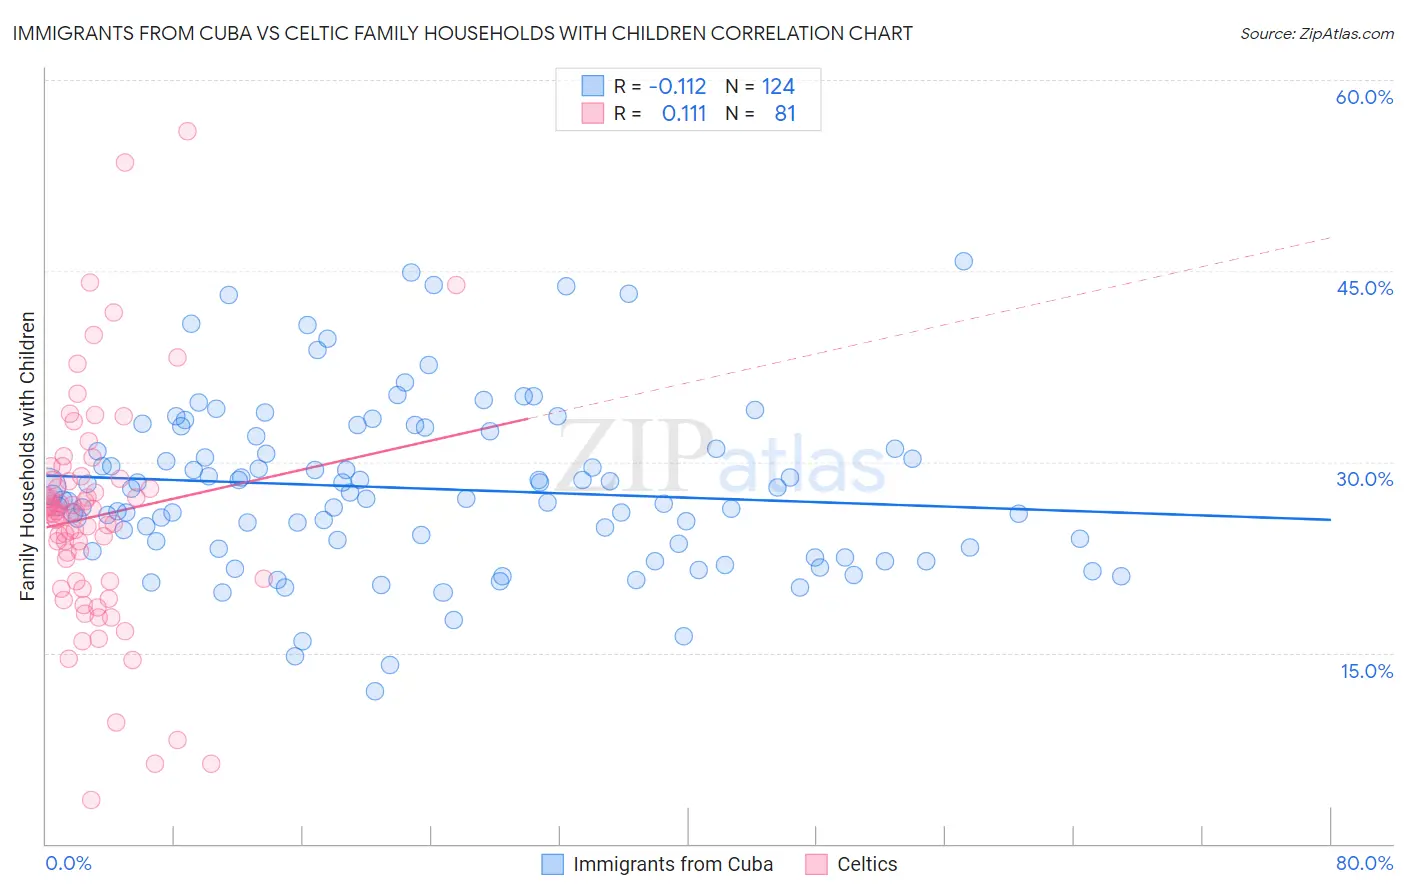
Immigrants from Cuba vs Celtic Family Households with Children Correlation Chart
The statistical analysis conducted on geographies consisting of 325,830,248 people shows a poor negative correlation between the proportion of Immigrants from Cuba and percentage of family households with children in the United States with a correlation coefficient (R) of -0.112 and weighted average of 26.8%. Similarly, the statistical analysis conducted on geographies consisting of 168,845,101 people shows a poor positive correlation between the proportion of Celtics and percentage of family households with children in the United States with a correlation coefficient (R) of 0.111 and weighted average of 26.6%, a difference of 0.63%.
Family Households with Children Correlation Summary
| Measurement | Immigrants from Cuba | Celtic |
| Minimum | 11.9% | 3.4% |
| Maximum | 45.7% | 55.9% |
| Range | 33.8% | 52.5% |
| Mean | 27.9% | 25.7% |
| Median | 27.3% | 26.1% |
| Interquartile 25% (IQ1) | 23.4% | 20.6% |
| Interquartile 75% (IQ3) | 31.5% | 28.7% |
| Interquartile Range (IQR) | 8.1% | 8.0% |
| Standard Deviation (Sample) | 6.6% | 9.0% |
| Standard Deviation (Population) | 6.6% | 9.0% |
Demographics Similar to Immigrants from Cuba and Celtics by Family Households with Children
In terms of family households with children, the demographic groups most similar to Immigrants from Cuba are Slavic (26.8%, a difference of 0.010%), Immigrants from Lithuania (26.8%, a difference of 0.030%), Immigrants from Jamaica (26.8%, a difference of 0.050%), Immigrants from Belarus (26.8%, a difference of 0.10%), and Immigrants from Russia (26.8%, a difference of 0.16%). Similarly, the demographic groups most similar to Celtics are Immigrants from Spain (26.6%, a difference of 0.080%), Immigrants from Northern Europe (26.7%, a difference of 0.11%), Immigrants from Hungary (26.7%, a difference of 0.20%), Eastern European (26.7%, a difference of 0.20%), and Somali (26.7%, a difference of 0.23%).
| Demographics | Rating | Rank | Family Households with Children |
| Slavs | 1.3 /100 | #257 | Tragic 26.8% |
| Immigrants | Cuba | 1.3 /100 | #258 | Tragic 26.8% |
| Immigrants | Lithuania | 1.2 /100 | #259 | Tragic 26.8% |
| Immigrants | Jamaica | 1.2 /100 | #260 | Tragic 26.8% |
| Immigrants | Belarus | 1.1 /100 | #261 | Tragic 26.8% |
| Immigrants | Russia | 1.0 /100 | #262 | Tragic 26.8% |
| Immigrants | North Macedonia | 1.0 /100 | #263 | Tragic 26.7% |
| Taiwanese | 0.9 /100 | #264 | Tragic 26.7% |
| Chippewa | 0.9 /100 | #265 | Tragic 26.7% |
| Maltese | 0.9 /100 | #266 | Tragic 26.7% |
| Immigrants | Uzbekistan | 0.9 /100 | #267 | Tragic 26.7% |
| Immigrants | Belgium | 0.9 /100 | #268 | Tragic 26.7% |
| Immigrants | Denmark | 0.8 /100 | #269 | Tragic 26.7% |
| Immigrants | Zaire | 0.7 /100 | #270 | Tragic 26.7% |
| French | 0.7 /100 | #271 | Tragic 26.7% |
| Somalis | 0.7 /100 | #272 | Tragic 26.7% |
| Immigrants | Hungary | 0.6 /100 | #273 | Tragic 26.7% |
| Eastern Europeans | 0.6 /100 | #274 | Tragic 26.7% |
| Immigrants | Northern Europe | 0.5 /100 | #275 | Tragic 26.7% |
| Immigrants | Spain | 0.5 /100 | #276 | Tragic 26.6% |
| Celtics | 0.4 /100 | #277 | Tragic 26.6% |