Immigrants from Cuba vs Burmese Family Households with Children
COMPARE
Immigrants from Cuba
Burmese
Family Households with Children
Family Households with Children Comparison
Immigrants from Cuba
Burmese
26.8%
FAMILY HOUSEHOLDS WITH CHILDREN
1.3/ 100
METRIC RATING
258th/ 347
METRIC RANK
28.5%
FAMILY HOUSEHOLDS WITH CHILDREN
99.9/ 100
METRIC RATING
71st/ 347
METRIC RANK
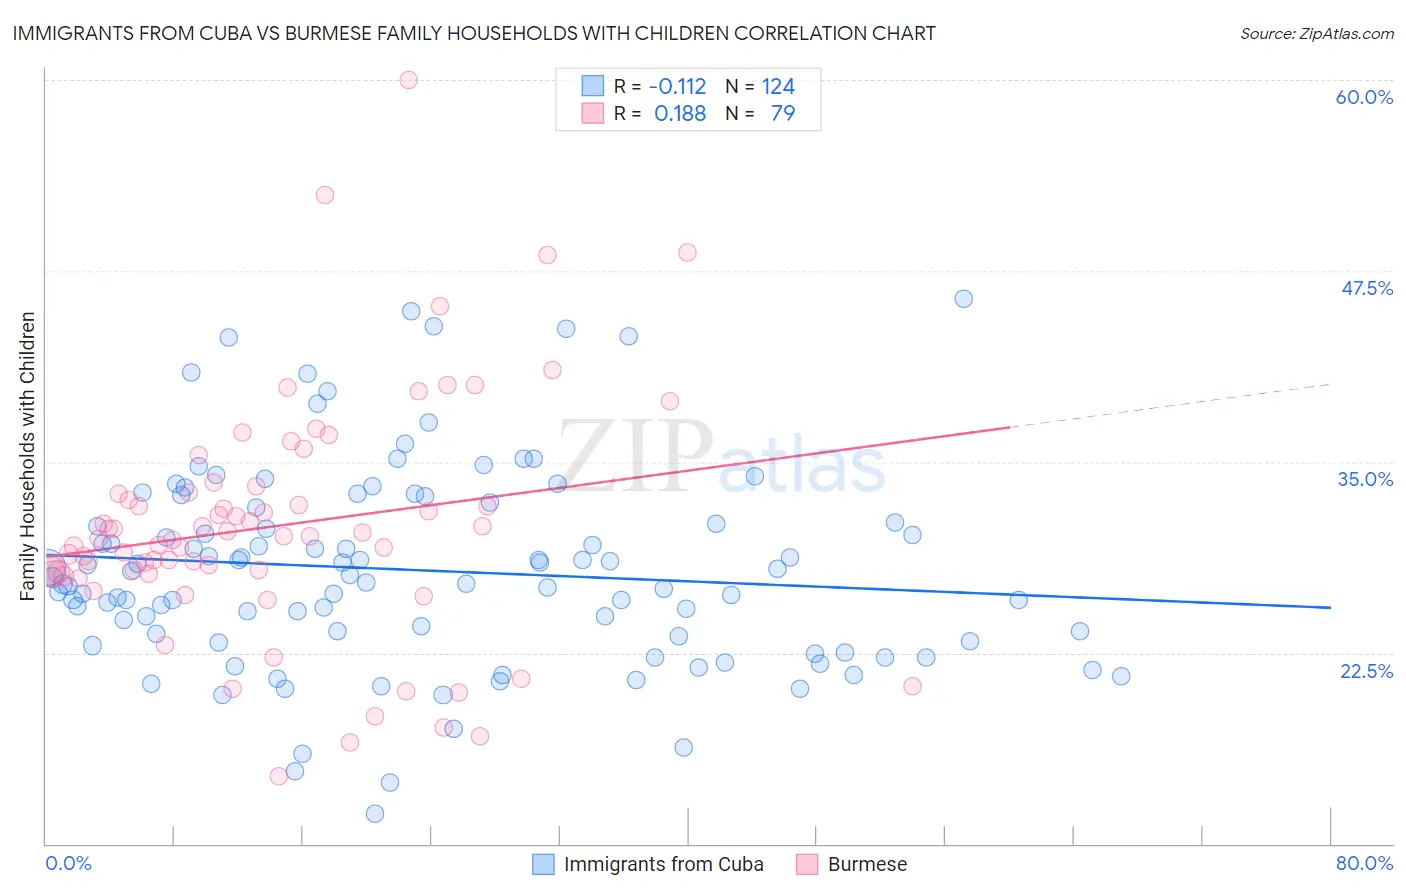
Immigrants from Cuba vs Burmese Family Households with Children Correlation Chart
The statistical analysis conducted on geographies consisting of 325,830,248 people shows a poor negative correlation between the proportion of Immigrants from Cuba and percentage of family households with children in the United States with a correlation coefficient (R) of -0.112 and weighted average of 26.8%. Similarly, the statistical analysis conducted on geographies consisting of 464,672,516 people shows a poor positive correlation between the proportion of Burmese and percentage of family households with children in the United States with a correlation coefficient (R) of 0.188 and weighted average of 28.5%, a difference of 6.4%.
Family Households with Children Correlation Summary
| Measurement | Immigrants from Cuba | Burmese |
| Minimum | 11.9% | 14.4% |
| Maximum | 45.7% | 60.0% |
| Range | 33.8% | 45.6% |
| Mean | 27.9% | 30.8% |
| Median | 27.3% | 30.1% |
| Interquartile 25% (IQ1) | 23.4% | 27.7% |
| Interquartile 75% (IQ3) | 31.5% | 33.0% |
| Interquartile Range (IQR) | 8.1% | 5.3% |
| Standard Deviation (Sample) | 6.6% | 7.8% |
| Standard Deviation (Population) | 6.6% | 7.8% |
Similar Demographics by Family Households with Children
Demographics Similar to Immigrants from Cuba by Family Households with Children
In terms of family households with children, the demographic groups most similar to Immigrants from Cuba are Slavic (26.8%, a difference of 0.010%), Immigrants from Lithuania (26.8%, a difference of 0.030%), Scotch-Irish (26.8%, a difference of 0.050%), Immigrants from Jamaica (26.8%, a difference of 0.050%), and Immigrants from Scotland (26.8%, a difference of 0.070%).
| Demographics | Rating | Rank | Family Households with Children |
| Immigrants | Bosnia and Herzegovina | 1.9 /100 | #251 | Tragic 26.8% |
| Irish | 1.8 /100 | #252 | Tragic 26.8% |
| Italians | 1.5 /100 | #253 | Tragic 26.8% |
| Immigrants | Scotland | 1.5 /100 | #254 | Tragic 26.8% |
| German Russians | 1.5 /100 | #255 | Tragic 26.8% |
| Scotch-Irish | 1.4 /100 | #256 | Tragic 26.8% |
| Slavs | 1.3 /100 | #257 | Tragic 26.8% |
| Immigrants | Cuba | 1.3 /100 | #258 | Tragic 26.8% |
| Immigrants | Lithuania | 1.2 /100 | #259 | Tragic 26.8% |
| Immigrants | Jamaica | 1.2 /100 | #260 | Tragic 26.8% |
| Immigrants | Belarus | 1.1 /100 | #261 | Tragic 26.8% |
| Immigrants | Russia | 1.0 /100 | #262 | Tragic 26.8% |
| Immigrants | North Macedonia | 1.0 /100 | #263 | Tragic 26.7% |
| Taiwanese | 0.9 /100 | #264 | Tragic 26.7% |
| Chippewa | 0.9 /100 | #265 | Tragic 26.7% |
Demographics Similar to Burmese by Family Households with Children
In terms of family households with children, the demographic groups most similar to Burmese are Immigrants from Honduras (28.5%, a difference of 0.010%), Immigrants from Indonesia (28.5%, a difference of 0.010%), Iraqi (28.5%, a difference of 0.040%), Laotian (28.5%, a difference of 0.060%), and Immigrants from Korea (28.5%, a difference of 0.070%).
| Demographics | Rating | Rank | Family Households with Children |
| Filipinos | 99.9 /100 | #64 | Exceptional 28.6% |
| Hondurans | 99.9 /100 | #65 | Exceptional 28.5% |
| Immigrants | Egypt | 99.9 /100 | #66 | Exceptional 28.5% |
| Ghanaians | 99.9 /100 | #67 | Exceptional 28.5% |
| Houma | 99.9 /100 | #68 | Exceptional 28.5% |
| Immigrants | Korea | 99.9 /100 | #69 | Exceptional 28.5% |
| Immigrants | Honduras | 99.9 /100 | #70 | Exceptional 28.5% |
| Burmese | 99.9 /100 | #71 | Exceptional 28.5% |
| Immigrants | Indonesia | 99.9 /100 | #72 | Exceptional 28.5% |
| Iraqis | 99.9 /100 | #73 | Exceptional 28.5% |
| Laotians | 99.9 /100 | #74 | Exceptional 28.5% |
| Immigrants | Jordan | 99.9 /100 | #75 | Exceptional 28.4% |
| Immigrants | Sri Lanka | 99.9 /100 | #76 | Exceptional 28.4% |
| Nigerians | 99.8 /100 | #77 | Exceptional 28.4% |
| Immigrants | Nepal | 99.8 /100 | #78 | Exceptional 28.4% |