Croatian vs Burmese Family Households with Children

COMPARE

Croatian
Race
Ancestry
AfghanAfricanAlaska NativeAlaskan AthabascanAlbanianAleutAlsatianAmericanApacheArabArapahoArgentineanArmenianAssyrian/Chaldean/SyriacAustralianAustrianBahamianBangladeshiBarbadianBasqueBelgianBelizeanBermudanBhutaneseBlackfeetBolivianBrazilianBritishBritish West IndianBulgarianCajunCambodianCanadianCape VerdeanCarpatho RusynCelticCentral AmericanCentral American IndianCherokeeCheyenneChickasawChileanChineseChippewaChoctawColombianColvilleComancheCosta RicanCreeCreekCroatianCrowCubanCypriotCzechCzechoslovakianDanishDelawareDominicanDutchDutch West IndianEastern EuropeanEcuadorianEgyptianEnglishEstonianEthiopianEuropeanFijianFilipinoFinnishFrenchFrench American IndianFrench CanadianGermanGerman RussianGhanaianGreekGuamanian/ChamorroGuatemalanGuyaneseHaitianHmongHonduranHopiHoumaHungarianIcelanderIndian (Asian)IndonesianInupiatIranianIraqiIrishIroquoisIsraeliItalianJamaicanJapaneseJordanianKenyanKiowaKoreanLaotianLatvianLebaneseLiberianLithuanianLumbeeLuxembourgerMacedonianMalaysianMalteseMarshalleseMenomineeMexicanMexican American IndianMongolianMoroccanNative HawaiianNavajoNepaleseNew ZealanderNicaraguanNigerianNorthern EuropeanNorwegianOkinawanOsageOttawaPaiutePakistaniPalestinianPanamanianParaguayanPennsylvania GermanPeruvianPimaPolishPortuguesePotawatomiPuebloPuerto RicanPuget Sound SalishRomanianRussianSalvadoranSamoanScandinavianScotch-IrishScottishSeminoleSenegaleseSerbianShoshoneSierra LeoneanSiouxSlavicSlovakSloveneSomaliSouth AfricanSouth AmericanSouth American IndianSoviet UnionSpaniardSpanishSpanish AmericanSpanish American IndianSri LankanSubsaharan AfricanSudaneseSwedishSwissSyrianTaiwaneseThaiTlingit-HaidaTohono O'OdhamTonganTrinidadian and TobagonianTsimshianTurkishU.S. Virgin IslanderUgandanUkrainianUruguayanUteVenezuelanVietnameseWelshWest IndianYakamaYaquiYugoslavianYumanYup'ikZimbabwean
Immigration
NonimmigrantsImmigrantsAfghanistanAfricaAlbaniaArgentinaArmeniaAsiaAustraliaAustriaBahamasBangladeshBarbadosBelarusBelgiumBelizeBoliviaBosnia and HerzegovinaBrazilBulgariaBurma/MyanmarCabo VerdeCambodiaCameroonCanadaCaribbeanCentral AmericaChileChinaColombiaCongoCosta RicaCroatiaCubaCzechoslovakiaDenmarkDominicaDominican RepublicEastern AfricaEastern AsiaEastern EuropeEcuadorEgyptEl SalvadorEnglandEritreaEthiopiaEuropeFijiFranceGermanyGhanaGreeceGrenadaGuatemalaGuyanaHaitiHondurasHong KongHungaryIndiaIndonesiaIranIraqIrelandIsraelItalyJamaicaJapanJordanKazakhstanKenyaKoreaKuwaitLaosLatin AmericaLatviaLebanonLiberiaLithuaniaMalaysiaMexicoMicronesiaMiddle AfricaMoldovaMoroccoNepalNetherlandsNicaraguaNigeriaNorth AmericaNorth MacedoniaNorthern AfricaNorthern EuropeNorwayOceaniaPakistanPanamaPeruPhilippinesPolandPortugalRomaniaRussiaSaudi ArabiaScotlandSenegalSerbiaSierra LeoneSingaporeSomaliaSouth AfricaSouth AmericaSouth Central AsiaSouth Eastern AsiaSouthern EuropeSpainSri LankaSt. Vincent and the GrenadinesSudanSwedenSwitzerlandSyriaTaiwanThailandTrinidad and TobagoTurkeyUgandaUkraineUruguayUzbekistanVenezuelaVietnamWest IndiesWestern AfricaWestern AsiaWestern EuropeYemenZaireZimbabweAzores
Burmese
Race
Ancestry
AfghanAfricanAlaska NativeAlaskan AthabascanAlbanianAleutAlsatianAmericanApacheArabArapahoArgentineanArmenianAssyrian/Chaldean/SyriacAustralianAustrianBahamianBangladeshiBarbadianBasqueBelgianBelizeanBermudanBhutaneseBlackfeetBolivianBrazilianBritishBritish West IndianBulgarianBurmeseCajunCambodianCanadianCape VerdeanCarpatho RusynCelticCentral AmericanCentral American IndianCherokeeCheyenneChickasawChileanChineseChippewaChoctawColombianColvilleComancheCosta RicanCreeCreekCrowCubanCypriotCzechCzechoslovakianDanishDelawareDominicanDutchDutch West IndianEastern EuropeanEcuadorianEgyptianEnglishEstonianEthiopianEuropeanFijianFilipinoFinnishFrenchFrench American IndianFrench CanadianGermanGerman RussianGhanaianGreekGuamanian/ChamorroGuatemalanGuyaneseHaitianHmongHonduranHopiHoumaHungarianIcelanderIndian (Asian)IndonesianInupiatIranianIraqiIrishIroquoisIsraeliItalianJamaicanJapaneseJordanianKenyanKiowaKoreanLaotianLatvianLebaneseLiberianLithuanianLumbeeLuxembourgerMacedonianMalaysianMalteseMarshalleseMenomineeMexicanMexican American IndianMongolianMoroccanNative HawaiianNavajoNepaleseNew ZealanderNicaraguanNigerianNorthern EuropeanNorwegianOkinawanOsageOttawaPaiutePakistaniPalestinianPanamanianParaguayanPennsylvania GermanPeruvianPimaPolishPortuguesePotawatomiPuebloPuerto RicanPuget Sound SalishRomanianRussianSalvadoranSamoanScandinavianScotch-IrishScottishSeminoleSenegaleseSerbianShoshoneSierra LeoneanSiouxSlavicSlovakSloveneSomaliSouth AfricanSouth AmericanSouth American IndianSoviet UnionSpaniardSpanishSpanish AmericanSpanish American IndianSri LankanSubsaharan AfricanSudaneseSwedishSwissSyrianTaiwaneseThaiTlingit-HaidaTohono O'OdhamTonganTrinidadian and TobagonianTsimshianTurkishU.S. Virgin IslanderUgandanUkrainianUruguayanUteVenezuelanVietnameseWelshWest IndianYakamaYaquiYugoslavianYumanYup'ikZimbabwean
Immigration
NonimmigrantsImmigrantsAfghanistanAfricaAlbaniaArgentinaArmeniaAsiaAustraliaAustriaBahamasBangladeshBarbadosBelarusBelgiumBelizeBoliviaBosnia and HerzegovinaBrazilBulgariaBurma/MyanmarCabo VerdeCambodiaCameroonCanadaCaribbeanCentral AmericaChileChinaColombiaCongoCosta RicaCroatiaCubaCzechoslovakiaDenmarkDominicaDominican RepublicEastern AfricaEastern AsiaEastern EuropeEcuadorEgyptEl SalvadorEnglandEritreaEthiopiaEuropeFijiFranceGermanyGhanaGreeceGrenadaGuatemalaGuyanaHaitiHondurasHong KongHungaryIndiaIndonesiaIranIraqIrelandIsraelItalyJamaicaJapanJordanKazakhstanKenyaKoreaKuwaitLaosLatin AmericaLatviaLebanonLiberiaLithuaniaMalaysiaMexicoMicronesiaMiddle AfricaMoldovaMoroccoNepalNetherlandsNicaraguaNigeriaNorth AmericaNorth MacedoniaNorthern AfricaNorthern EuropeNorwayOceaniaPakistanPanamaPeruPhilippinesPolandPortugalRomaniaRussiaSaudi ArabiaScotlandSenegalSerbiaSierra LeoneSingaporeSomaliaSouth AfricaSouth AmericaSouth Central AsiaSouth Eastern AsiaSouthern EuropeSpainSri LankaSt. Vincent and the GrenadinesSudanSwedenSwitzerlandSyriaTaiwanThailandTrinidad and TobagoTurkeyUgandaUkraineUruguayUzbekistanVenezuelaVietnamWest IndiesWestern AfricaWestern AsiaWestern EuropeYemenZaireZimbabweAzores
Family Households with Children
Income
Poverty
Unemployment
Labor Participation
Family Structure
Vehicle Availability
Education Level
Disability

Family Households with Children Comparison

Croatians

Burmese

Tragic
Exceptional
26.4%
FAMILY HOUSEHOLDS WITH CHILDREN
0.1/ 100
METRIC RATING
296th/ 347
METRIC RANK
28.5%
FAMILY HOUSEHOLDS WITH CHILDREN
99.9/ 100
METRIC RATING
71st/ 347
METRIC RANK

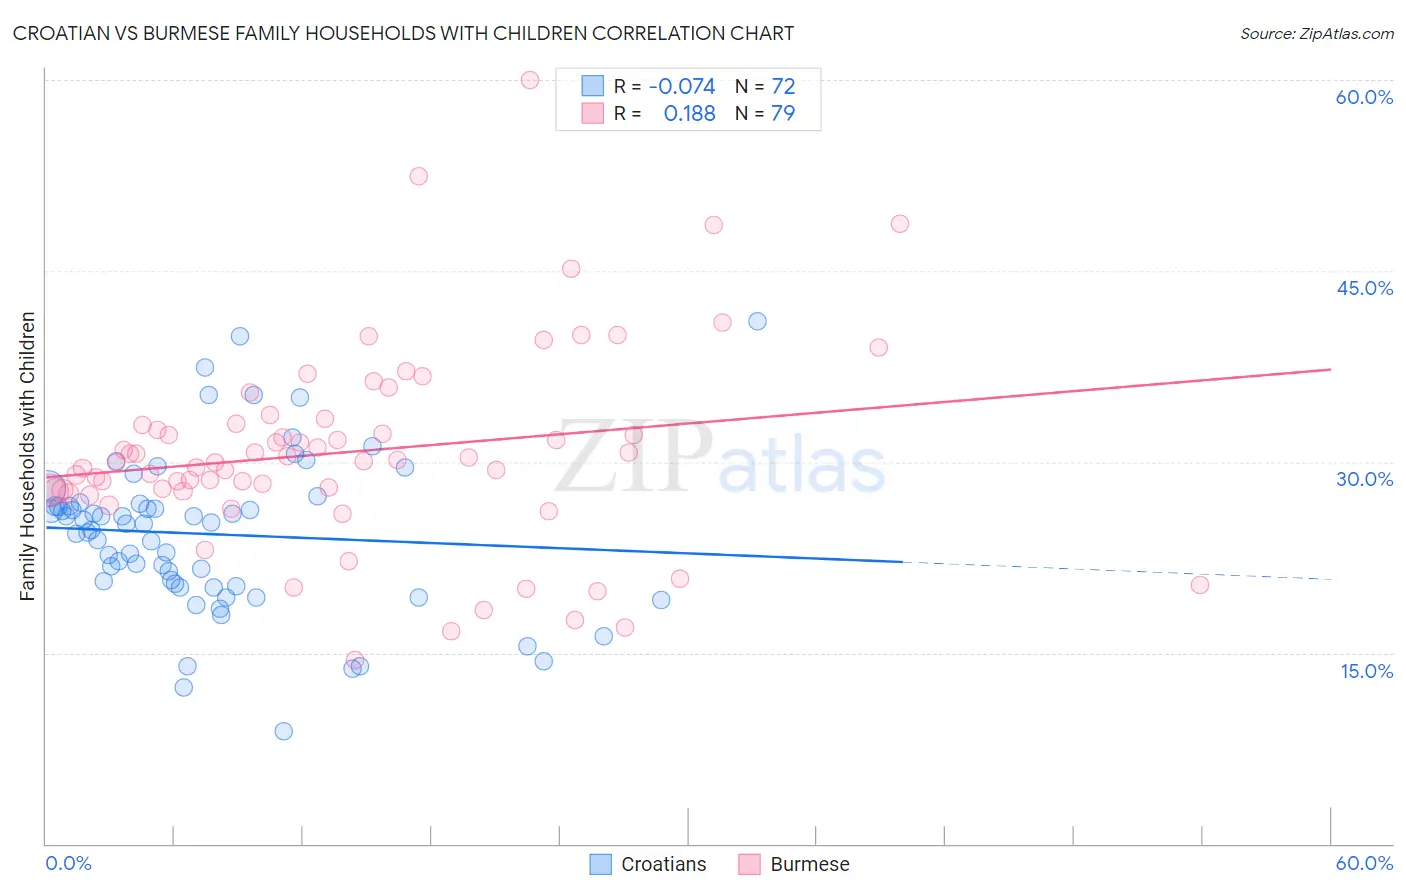
Croatian vs Burmese Family Households with Children Correlation Chart

The statistical analysis conducted on geographies consisting of 375,401,483 people shows a slight negative correlation between the proportion of Croatians and percentage of family households with children in the United States with a correlation coefficient (R) of -0.074 and weighted average of 26.4%. Similarly, the statistical analysis conducted on geographies consisting of 464,672,516 people shows a poor positive correlation between the proportion of Burmese and percentage of family households with children in the United States with a correlation coefficient (R) of 0.188 and weighted average of 28.5%, a difference of 7.9%.
Croatian vs Burmese Family Households with Children

Family Households with Children Correlation Summary

MeasurementCroatianBurmese
Minimum8.8%14.4%
Maximum41.0%60.0%
Range32.2%45.6%
Mean24.3%30.8%
Median25.1%30.1%
Interquartile 25% (IQ1)20.3%27.7%
Interquartile 75% (IQ3)26.6%33.0%
Interquartile Range (IQR)6.3%5.3%
Standard Deviation (Sample)6.2%7.8%
Standard Deviation (Population)6.2%7.8%

Similar Demographics by Family Households with Children

Demographics Similar to Croatians by Family Households with Children

In terms of family households with children, the demographic groups most similar to Croatians are Armenian (26.4%, a difference of 0.010%), Macedonian (26.4%, a difference of 0.020%), Latvian (26.4%, a difference of 0.10%), Immigrants from Western Europe (26.4%, a difference of 0.11%), and Trinidadian and Tobagonian (26.4%, a difference of 0.12%).
DemographicsRating | RankFamily Households with Children
Immigrants | Sweden
0.2
/100
|
#289
Tragic
26.5%
Albanians
0.2
/100
|
#290
Tragic
26.5%
Bahamians
0.2
/100
|
#291
Tragic
26.5%
Poles
0.2
/100
|
#292
Tragic
26.5%
Blacks/African Americans
0.1
/100
|
#293
Tragic
26.5%
Latvians
0.1
/100
|
#294
Tragic
26.4%
Macedonians
0.1
/100
|
#295
Tragic
26.4%
Croatians
0.1
/100
|
#296
Tragic
26.4%
Armenians
0.1
/100
|
#297
Tragic
26.4%
Immigrants | Western Europe
0.1
/100
|
#298
Tragic
26.4%
Trinidadians and Tobagonians
0.1
/100
|
#299
Tragic
26.4%
Paiute
0.1
/100
|
#300
Tragic
26.4%
Immigrants | Trinidad and Tobago
0.1
/100
|
#301
Tragic
26.4%
Serbians
0.1
/100
|
#302
Tragic
26.4%
Immigrants | Guyana
0.1
/100
|
#303
Tragic
26.3%

Demographics Similar to Burmese by Family Households with Children

In terms of family households with children, the demographic groups most similar to Burmese are Immigrants from Honduras (28.5%, a difference of 0.010%), Immigrants from Indonesia (28.5%, a difference of 0.010%), Iraqi (28.5%, a difference of 0.040%), Laotian (28.5%, a difference of 0.060%), and Immigrants from Korea (28.5%, a difference of 0.070%).
DemographicsRating | RankFamily Households with Children
Filipinos
99.9
/100
|
#64
Exceptional
28.6%
Hondurans
99.9
/100
|
#65
Exceptional
28.5%
Immigrants | Egypt
99.9
/100
|
#66
Exceptional
28.5%
Ghanaians
99.9
/100
|
#67
Exceptional
28.5%
Houma
99.9
/100
|
#68
Exceptional
28.5%
Immigrants | Korea
99.9
/100
|
#69
Exceptional
28.5%
Immigrants | Honduras
99.9
/100
|
#70
Exceptional
28.5%
Burmese
99.9
/100
|
#71
Exceptional
28.5%
Immigrants | Indonesia
99.9
/100
|
#72
Exceptional
28.5%
Iraqis
99.9
/100
|
#73
Exceptional
28.5%
Laotians
99.9
/100
|
#74
Exceptional
28.5%
Immigrants | Jordan
99.9
/100
|
#75
Exceptional
28.4%
Immigrants | Sri Lanka
99.9
/100
|
#76
Exceptional
28.4%
Nigerians
99.8
/100
|
#77
Exceptional
28.4%
Immigrants | Nepal
99.8
/100
|
#78
Exceptional
28.4%