Immigrants from Central America vs Immigrants from Guatemala Family Households with Children
COMPARE
Immigrants from Central America
Immigrants from Guatemala
Family Households with Children
Family Households with Children Comparison
Immigrants from Central America
Immigrants from Guatemala
31.0%
FAMILY HOUSEHOLDS WITH CHILDREN
100.0/ 100
METRIC RATING
7th/ 347
METRIC RANK
28.8%
FAMILY HOUSEHOLDS WITH CHILDREN
100.0/ 100
METRIC RATING
56th/ 347
METRIC RANK
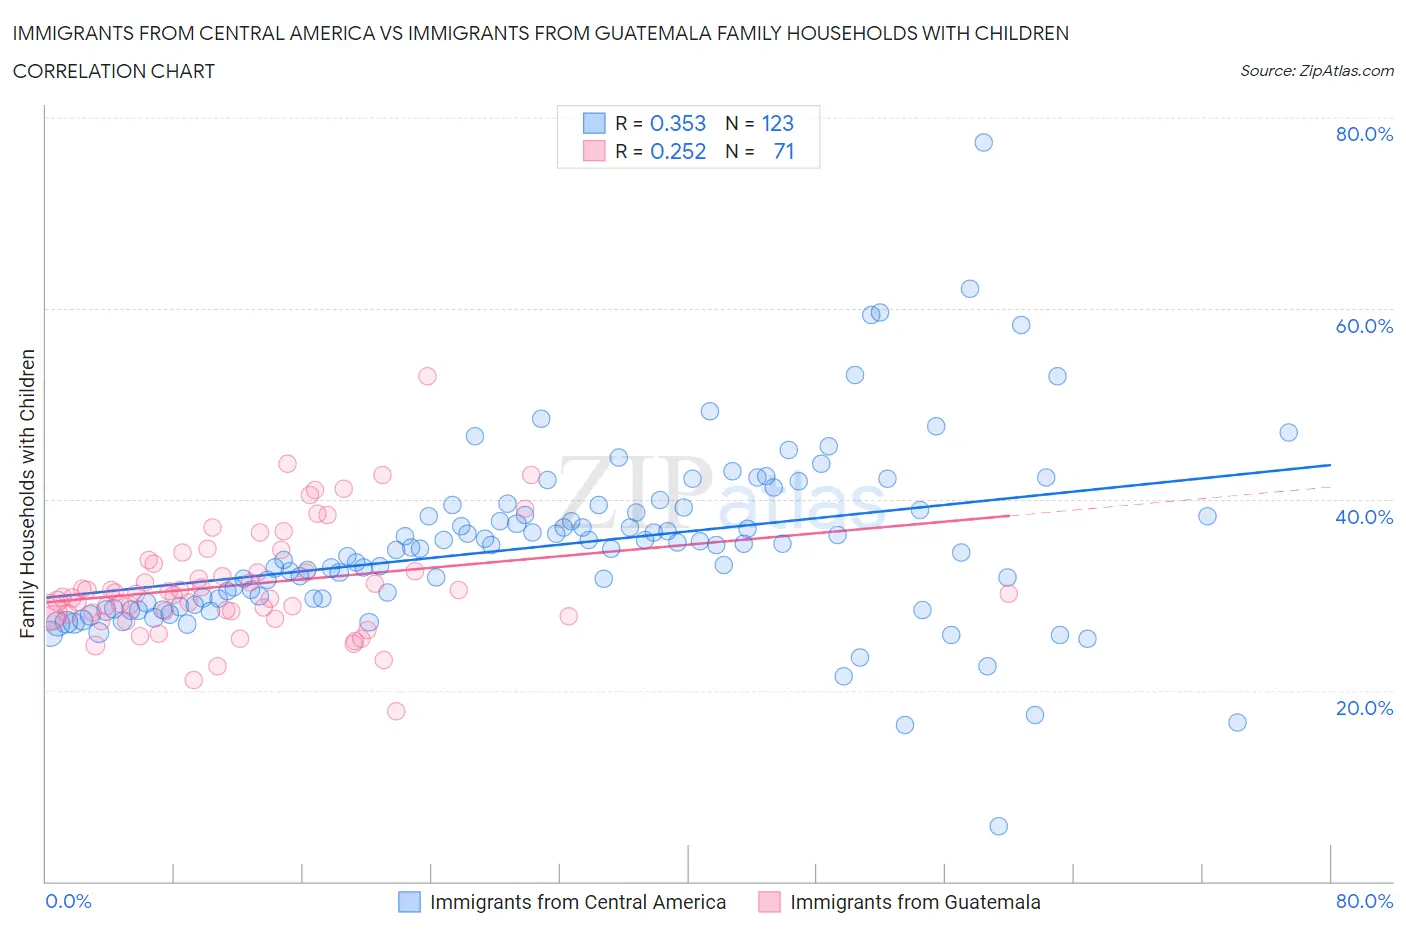
Immigrants from Central America vs Immigrants from Guatemala Family Households with Children Correlation Chart
The statistical analysis conducted on geographies consisting of 535,819,231 people shows a mild positive correlation between the proportion of Immigrants from Central America and percentage of family households with children in the United States with a correlation coefficient (R) of 0.353 and weighted average of 31.0%. Similarly, the statistical analysis conducted on geographies consisting of 377,133,401 people shows a weak positive correlation between the proportion of Immigrants from Guatemala and percentage of family households with children in the United States with a correlation coefficient (R) of 0.252 and weighted average of 28.8%, a difference of 7.4%.
Family Households with Children Correlation Summary
| Measurement | Immigrants from Central America | Immigrants from Guatemala |
| Minimum | 5.8% | 17.8% |
| Maximum | 77.4% | 52.9% |
| Range | 71.6% | 35.2% |
| Mean | 35.2% | 31.1% |
| Median | 34.8% | 30.1% |
| Interquartile 25% (IQ1) | 29.0% | 28.0% |
| Interquartile 75% (IQ3) | 38.9% | 33.3% |
| Interquartile Range (IQR) | 9.9% | 5.3% |
| Standard Deviation (Sample) | 9.4% | 5.8% |
| Standard Deviation (Population) | 9.4% | 5.7% |
Similar Demographics by Family Households with Children
Demographics Similar to Immigrants from Central America by Family Households with Children
In terms of family households with children, the demographic groups most similar to Immigrants from Central America are Immigrants from India (31.0%, a difference of 0.29%), Yakama (30.8%, a difference of 0.57%), Tongan (31.2%, a difference of 0.91%), Thai (30.6%, a difference of 1.1%), and Mexican (31.4%, a difference of 1.3%).
| Demographics | Rating | Rank | Family Households with Children |
| Yup'ik | 100 /100 | #1 | Exceptional 37.0% |
| Inupiat | 100 /100 | #2 | Exceptional 32.8% |
| Immigrants | Mexico | 100.0 /100 | #3 | Exceptional 31.6% |
| Mexicans | 100.0 /100 | #4 | Exceptional 31.4% |
| Tongans | 100.0 /100 | #5 | Exceptional 31.2% |
| Immigrants | India | 100.0 /100 | #6 | Exceptional 31.0% |
| Immigrants | Central America | 100.0 /100 | #7 | Exceptional 31.0% |
| Yakama | 100.0 /100 | #8 | Exceptional 30.8% |
| Thais | 100.0 /100 | #9 | Exceptional 30.6% |
| Immigrants | Fiji | 100.0 /100 | #10 | Exceptional 30.5% |
| Nepalese | 100.0 /100 | #11 | Exceptional 30.5% |
| Immigrants | Pakistan | 100.0 /100 | #12 | Exceptional 30.2% |
| Afghans | 100.0 /100 | #13 | Exceptional 30.2% |
| Bangladeshis | 100.0 /100 | #14 | Exceptional 30.1% |
| Immigrants | South Central Asia | 100.0 /100 | #15 | Exceptional 30.0% |
Demographics Similar to Immigrants from Guatemala by Family Households with Children
In terms of family households with children, the demographic groups most similar to Immigrants from Guatemala are Immigrants from Asia (28.8%, a difference of 0.070%), Sierra Leonean (28.9%, a difference of 0.14%), Immigrants from Cambodia (28.9%, a difference of 0.21%), Danish (28.7%, a difference of 0.24%), and Guatemalan (28.9%, a difference of 0.28%).
| Demographics | Rating | Rank | Family Households with Children |
| Jordanians | 100.0 /100 | #49 | Exceptional 29.0% |
| Immigrants | Immigrants | 100.0 /100 | #50 | Exceptional 28.9% |
| Immigrants | Peru | 100.0 /100 | #51 | Exceptional 28.9% |
| Guatemalans | 100.0 /100 | #52 | Exceptional 28.9% |
| Immigrants | Cambodia | 100.0 /100 | #53 | Exceptional 28.9% |
| Sierra Leoneans | 100.0 /100 | #54 | Exceptional 28.9% |
| Immigrants | Asia | 100.0 /100 | #55 | Exceptional 28.8% |
| Immigrants | Guatemala | 100.0 /100 | #56 | Exceptional 28.8% |
| Danes | 100.0 /100 | #57 | Exceptional 28.7% |
| Hawaiians | 100.0 /100 | #58 | Exceptional 28.7% |
| Immigrants | Nigeria | 100.0 /100 | #59 | Exceptional 28.6% |
| Hmong | 99.9 /100 | #60 | Exceptional 28.6% |
| Immigrants | Ghana | 99.9 /100 | #61 | Exceptional 28.6% |
| Egyptians | 99.9 /100 | #62 | Exceptional 28.6% |
| Immigrants | Lebanon | 99.9 /100 | #63 | Exceptional 28.6% |