Immigrants from Sierra Leone vs Immigrants from Guatemala Family Households with Children
COMPARE
Immigrants from Sierra Leone
Immigrants from Guatemala
Family Households with Children
Family Households with Children Comparison
Immigrants from Sierra Leone
Immigrants from Guatemala
29.3%
FAMILY HOUSEHOLDS WITH CHILDREN
100.0/ 100
METRIC RATING
35th/ 347
METRIC RANK
28.8%
FAMILY HOUSEHOLDS WITH CHILDREN
100.0/ 100
METRIC RATING
56th/ 347
METRIC RANK
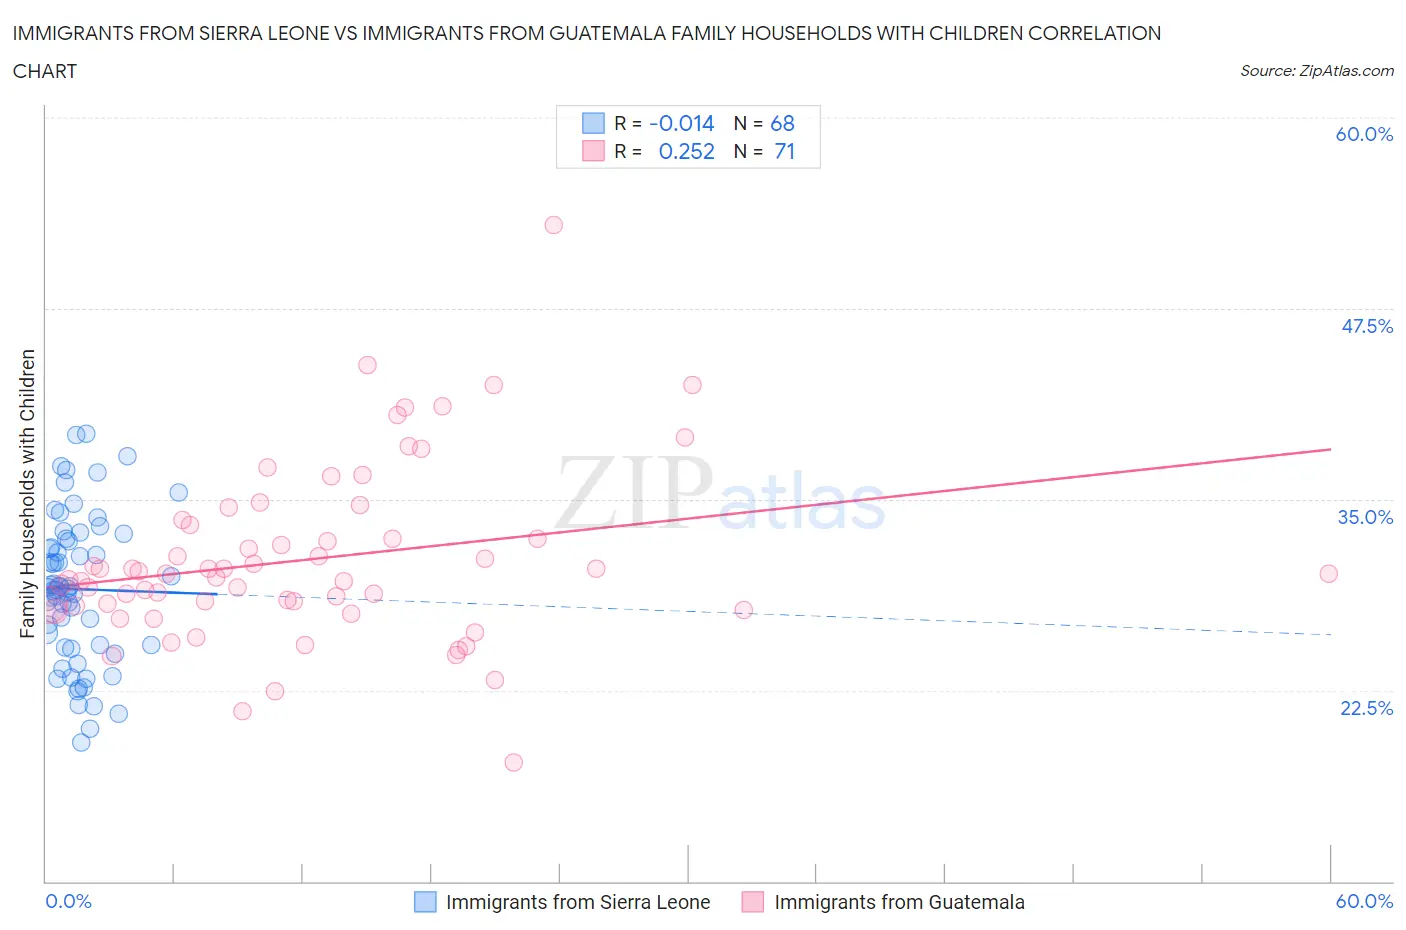
Immigrants from Sierra Leone vs Immigrants from Guatemala Family Households with Children Correlation Chart
The statistical analysis conducted on geographies consisting of 101,637,197 people shows no correlation between the proportion of Immigrants from Sierra Leone and percentage of family households with children in the United States with a correlation coefficient (R) of -0.014 and weighted average of 29.3%. Similarly, the statistical analysis conducted on geographies consisting of 377,133,401 people shows a weak positive correlation between the proportion of Immigrants from Guatemala and percentage of family households with children in the United States with a correlation coefficient (R) of 0.252 and weighted average of 28.8%, a difference of 1.7%.
Family Households with Children Correlation Summary
| Measurement | Immigrants from Sierra Leone | Immigrants from Guatemala |
| Minimum | 19.1% | 17.8% |
| Maximum | 39.3% | 52.9% |
| Range | 20.2% | 35.2% |
| Mean | 29.1% | 31.1% |
| Median | 29.2% | 30.1% |
| Interquartile 25% (IQ1) | 25.4% | 28.0% |
| Interquartile 75% (IQ3) | 32.3% | 33.3% |
| Interquartile Range (IQR) | 6.9% | 5.3% |
| Standard Deviation (Sample) | 4.8% | 5.8% |
| Standard Deviation (Population) | 4.8% | 5.7% |
Similar Demographics by Family Households with Children
Demographics Similar to Immigrants from Sierra Leone by Family Households with Children
In terms of family households with children, the demographic groups most similar to Immigrants from Sierra Leone are Immigrants from Venezuela (29.3%, a difference of 0.010%), Immigrants from Bolivia (29.3%, a difference of 0.16%), Venezuelan (29.4%, a difference of 0.22%), Immigrants from Cameroon (29.2%, a difference of 0.28%), and Immigrants from Yemen (29.4%, a difference of 0.41%).
| Demographics | Rating | Rank | Family Households with Children |
| Samoans | 100.0 /100 | #28 | Exceptional 29.5% |
| Bolivians | 100.0 /100 | #29 | Exceptional 29.5% |
| Yuman | 100.0 /100 | #30 | Exceptional 29.5% |
| Japanese | 100.0 /100 | #31 | Exceptional 29.4% |
| Immigrants | Yemen | 100.0 /100 | #32 | Exceptional 29.4% |
| Venezuelans | 100.0 /100 | #33 | Exceptional 29.4% |
| Immigrants | Bolivia | 100.0 /100 | #34 | Exceptional 29.3% |
| Immigrants | Sierra Leone | 100.0 /100 | #35 | Exceptional 29.3% |
| Immigrants | Venezuela | 100.0 /100 | #36 | Exceptional 29.3% |
| Immigrants | Cameroon | 100.0 /100 | #37 | Exceptional 29.2% |
| Koreans | 100.0 /100 | #38 | Exceptional 29.2% |
| Yaqui | 100.0 /100 | #39 | Exceptional 29.1% |
| Central Americans | 100.0 /100 | #40 | Exceptional 29.1% |
| Immigrants | South Eastern Asia | 100.0 /100 | #41 | Exceptional 29.1% |
| Spanish American Indians | 100.0 /100 | #42 | Exceptional 29.1% |
Demographics Similar to Immigrants from Guatemala by Family Households with Children
In terms of family households with children, the demographic groups most similar to Immigrants from Guatemala are Immigrants from Asia (28.8%, a difference of 0.070%), Sierra Leonean (28.9%, a difference of 0.14%), Immigrants from Cambodia (28.9%, a difference of 0.21%), Danish (28.7%, a difference of 0.24%), and Guatemalan (28.9%, a difference of 0.28%).
| Demographics | Rating | Rank | Family Households with Children |
| Jordanians | 100.0 /100 | #49 | Exceptional 29.0% |
| Immigrants | Immigrants | 100.0 /100 | #50 | Exceptional 28.9% |
| Immigrants | Peru | 100.0 /100 | #51 | Exceptional 28.9% |
| Guatemalans | 100.0 /100 | #52 | Exceptional 28.9% |
| Immigrants | Cambodia | 100.0 /100 | #53 | Exceptional 28.9% |
| Sierra Leoneans | 100.0 /100 | #54 | Exceptional 28.9% |
| Immigrants | Asia | 100.0 /100 | #55 | Exceptional 28.8% |
| Immigrants | Guatemala | 100.0 /100 | #56 | Exceptional 28.8% |
| Danes | 100.0 /100 | #57 | Exceptional 28.7% |
| Hawaiians | 100.0 /100 | #58 | Exceptional 28.7% |
| Immigrants | Nigeria | 100.0 /100 | #59 | Exceptional 28.6% |
| Hmong | 99.9 /100 | #60 | Exceptional 28.6% |
| Immigrants | Ghana | 99.9 /100 | #61 | Exceptional 28.6% |
| Egyptians | 99.9 /100 | #62 | Exceptional 28.6% |
| Immigrants | Lebanon | 99.9 /100 | #63 | Exceptional 28.6% |