Immigrants from Central America vs Immigrants from Belize Family Households with Children
COMPARE
Immigrants from Central America
Immigrants from Belize
Family Households with Children
Family Households with Children Comparison
Immigrants from Central America
Immigrants from Belize
31.0%
FAMILY HOUSEHOLDS WITH CHILDREN
100.0/ 100
METRIC RATING
7th/ 347
METRIC RANK
27.7%
FAMILY HOUSEHOLDS WITH CHILDREN
85.7/ 100
METRIC RATING
132nd/ 347
METRIC RANK
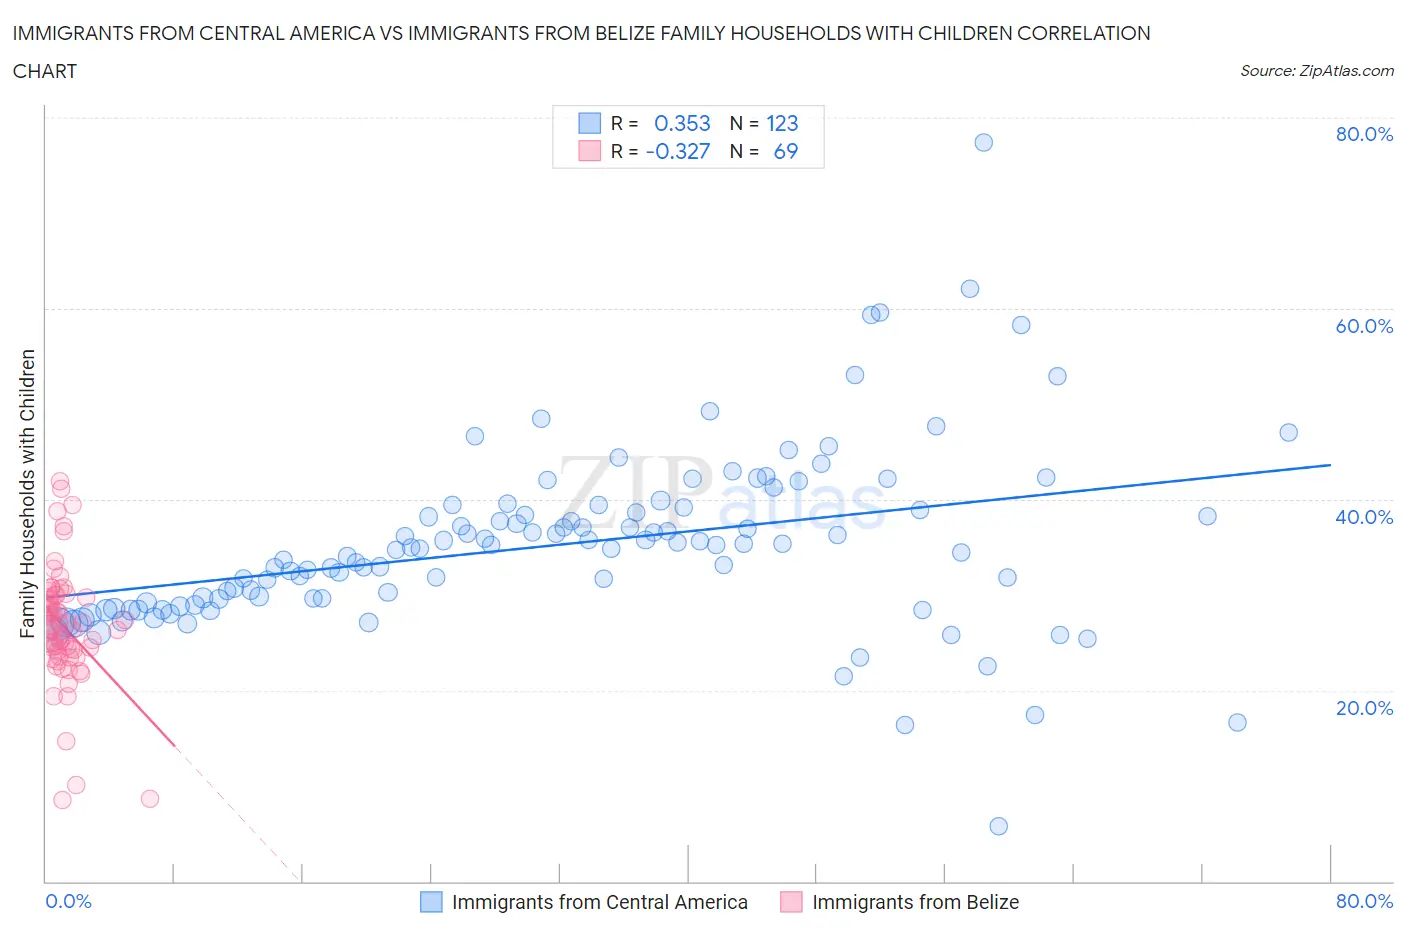
Immigrants from Central America vs Immigrants from Belize Family Households with Children Correlation Chart
The statistical analysis conducted on geographies consisting of 535,819,231 people shows a mild positive correlation between the proportion of Immigrants from Central America and percentage of family households with children in the United States with a correlation coefficient (R) of 0.353 and weighted average of 31.0%. Similarly, the statistical analysis conducted on geographies consisting of 130,285,570 people shows a mild negative correlation between the proportion of Immigrants from Belize and percentage of family households with children in the United States with a correlation coefficient (R) of -0.327 and weighted average of 27.7%, a difference of 11.7%.
Family Households with Children Correlation Summary
| Measurement | Immigrants from Central America | Immigrants from Belize |
| Minimum | 5.8% | 8.5% |
| Maximum | 77.4% | 42.0% |
| Range | 71.6% | 33.4% |
| Mean | 35.2% | 26.6% |
| Median | 34.8% | 26.4% |
| Interquartile 25% (IQ1) | 29.0% | 23.9% |
| Interquartile 75% (IQ3) | 38.9% | 29.9% |
| Interquartile Range (IQR) | 9.9% | 6.0% |
| Standard Deviation (Sample) | 9.4% | 6.3% |
| Standard Deviation (Population) | 9.4% | 6.2% |
Similar Demographics by Family Households with Children
Demographics Similar to Immigrants from Central America by Family Households with Children
In terms of family households with children, the demographic groups most similar to Immigrants from Central America are Immigrants from India (31.0%, a difference of 0.29%), Yakama (30.8%, a difference of 0.57%), Tongan (31.2%, a difference of 0.91%), Thai (30.6%, a difference of 1.1%), and Mexican (31.4%, a difference of 1.3%).
| Demographics | Rating | Rank | Family Households with Children |
| Yup'ik | 100 /100 | #1 | Exceptional 37.0% |
| Inupiat | 100 /100 | #2 | Exceptional 32.8% |
| Immigrants | Mexico | 100.0 /100 | #3 | Exceptional 31.6% |
| Mexicans | 100.0 /100 | #4 | Exceptional 31.4% |
| Tongans | 100.0 /100 | #5 | Exceptional 31.2% |
| Immigrants | India | 100.0 /100 | #6 | Exceptional 31.0% |
| Immigrants | Central America | 100.0 /100 | #7 | Exceptional 31.0% |
| Yakama | 100.0 /100 | #8 | Exceptional 30.8% |
| Thais | 100.0 /100 | #9 | Exceptional 30.6% |
| Immigrants | Fiji | 100.0 /100 | #10 | Exceptional 30.5% |
| Nepalese | 100.0 /100 | #11 | Exceptional 30.5% |
| Immigrants | Pakistan | 100.0 /100 | #12 | Exceptional 30.2% |
| Afghans | 100.0 /100 | #13 | Exceptional 30.2% |
| Bangladeshis | 100.0 /100 | #14 | Exceptional 30.1% |
| Immigrants | South Central Asia | 100.0 /100 | #15 | Exceptional 30.0% |
Demographics Similar to Immigrants from Belize by Family Households with Children
In terms of family households with children, the demographic groups most similar to Immigrants from Belize are Iranian (27.7%, a difference of 0.020%), Immigrants from Panama (27.7%, a difference of 0.040%), Immigrants from Ecuador (27.7%, a difference of 0.050%), Immigrants from Portugal (27.7%, a difference of 0.070%), and Lebanese (27.7%, a difference of 0.080%).
| Demographics | Rating | Rank | Family Households with Children |
| Ecuadorians | 90.8 /100 | #125 | Exceptional 27.8% |
| Immigrants | Ethiopia | 90.5 /100 | #126 | Exceptional 27.8% |
| Belizeans | 90.0 /100 | #127 | Exceptional 27.8% |
| Syrians | 89.7 /100 | #128 | Excellent 27.8% |
| Immigrants | Eritrea | 89.4 /100 | #129 | Excellent 27.8% |
| Cajuns | 87.6 /100 | #130 | Excellent 27.7% |
| Lebanese | 87.4 /100 | #131 | Excellent 27.7% |
| Immigrants | Belize | 85.7 /100 | #132 | Excellent 27.7% |
| Iranians | 85.2 /100 | #133 | Excellent 27.7% |
| Immigrants | Panama | 84.9 /100 | #134 | Excellent 27.7% |
| Immigrants | Ecuador | 84.6 /100 | #135 | Excellent 27.7% |
| Immigrants | Portugal | 84.1 /100 | #136 | Excellent 27.7% |
| Immigrants | Dominican Republic | 83.9 /100 | #137 | Excellent 27.7% |
| Uruguayans | 83.2 /100 | #138 | Excellent 27.7% |
| Vietnamese | 82.6 /100 | #139 | Excellent 27.7% |