Immigrants from Central America vs Bahamian Births to Unmarried Women
COMPARE
Immigrants from Central America
Bahamian
Births to Unmarried Women
Births to Unmarried Women Comparison
Immigrants from Central America
Bahamians
37.4%
BIRTHS TO UNMARRIED WOMEN
0.0/ 100
METRIC RATING
284th/ 347
METRIC RANK
40.8%
BIRTHS TO UNMARRIED WOMEN
0.0/ 100
METRIC RATING
321st/ 347
METRIC RANK
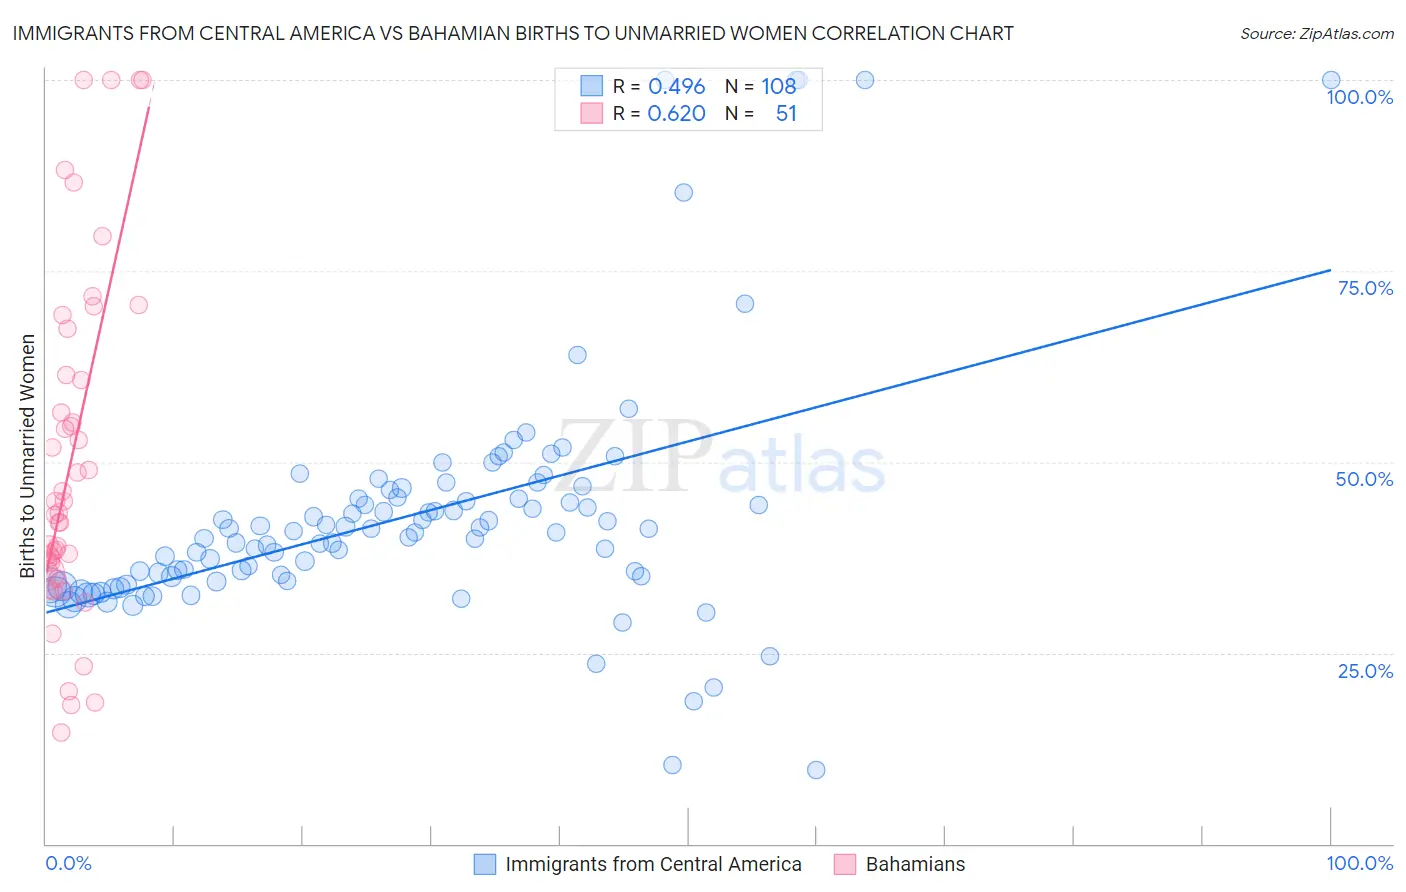
Immigrants from Central America vs Bahamian Births to Unmarried Women Correlation Chart
The statistical analysis conducted on geographies consisting of 486,080,403 people shows a moderate positive correlation between the proportion of Immigrants from Central America and percentage of births to unmarried women in the United States with a correlation coefficient (R) of 0.496 and weighted average of 37.4%. Similarly, the statistical analysis conducted on geographies consisting of 110,519,656 people shows a significant positive correlation between the proportion of Bahamians and percentage of births to unmarried women in the United States with a correlation coefficient (R) of 0.620 and weighted average of 40.8%, a difference of 8.9%.
Births to Unmarried Women Correlation Summary
| Measurement | Immigrants from Central America | Bahamian |
| Minimum | 9.7% | 14.6% |
| Maximum | 100.0% | 100.0% |
| Range | 90.3% | 85.4% |
| Mean | 42.8% | 50.1% |
| Median | 40.7% | 43.3% |
| Interquartile 25% (IQ1) | 34.4% | 35.7% |
| Interquartile 75% (IQ3) | 45.2% | 61.4% |
| Interquartile Range (IQR) | 10.9% | 25.6% |
| Standard Deviation (Sample) | 16.0% | 22.3% |
| Standard Deviation (Population) | 16.0% | 22.1% |
Similar Demographics by Births to Unmarried Women
Demographics Similar to Immigrants from Central America by Births to Unmarried Women
In terms of births to unmarried women, the demographic groups most similar to Immigrants from Central America are Spanish American Indian (37.4%, a difference of 0.060%), Immigrants from Mexico (37.5%, a difference of 0.10%), Immigrants from Guatemala (37.5%, a difference of 0.11%), Liberian (37.4%, a difference of 0.14%), and Immigrants from Belize (37.3%, a difference of 0.31%).
| Demographics | Rating | Rank | Births to Unmarried Women |
| Guatemalans | 0.1 /100 | #277 | Tragic 37.1% |
| Immigrants | Latin America | 0.1 /100 | #278 | Tragic 37.1% |
| West Indians | 0.1 /100 | #279 | Tragic 37.3% |
| Immigrants | St. Vincent and the Grenadines | 0.1 /100 | #280 | Tragic 37.3% |
| Immigrants | Belize | 0.1 /100 | #281 | Tragic 37.3% |
| Liberians | 0.0 /100 | #282 | Tragic 37.4% |
| Spanish American Indians | 0.0 /100 | #283 | Tragic 37.4% |
| Immigrants | Central America | 0.0 /100 | #284 | Tragic 37.4% |
| Immigrants | Mexico | 0.0 /100 | #285 | Tragic 37.5% |
| Immigrants | Guatemala | 0.0 /100 | #286 | Tragic 37.5% |
| Creek | 0.0 /100 | #287 | Tragic 37.6% |
| Immigrants | Liberia | 0.0 /100 | #288 | Tragic 37.6% |
| Alaskan Athabascans | 0.0 /100 | #289 | Tragic 37.7% |
| Hispanics or Latinos | 0.0 /100 | #290 | Tragic 37.8% |
| Seminole | 0.0 /100 | #291 | Tragic 37.9% |
Demographics Similar to Bahamians by Births to Unmarried Women
In terms of births to unmarried women, the demographic groups most similar to Bahamians are Cajun (41.0%, a difference of 0.49%), Sioux (41.0%, a difference of 0.56%), Crow (40.4%, a difference of 1.0%), Yakama (40.3%, a difference of 1.1%), and Cape Verdean (41.3%, a difference of 1.4%).
| Demographics | Rating | Rank | Births to Unmarried Women |
| Immigrants | Caribbean | 0.0 /100 | #314 | Tragic 39.8% |
| Dominicans | 0.0 /100 | #315 | Tragic 39.8% |
| Apache | 0.0 /100 | #316 | Tragic 39.9% |
| Immigrants | Dominican Republic | 0.0 /100 | #317 | Tragic 40.1% |
| Immigrants | Bahamas | 0.0 /100 | #318 | Tragic 40.1% |
| Yakama | 0.0 /100 | #319 | Tragic 40.3% |
| Crow | 0.0 /100 | #320 | Tragic 40.4% |
| Bahamians | 0.0 /100 | #321 | Tragic 40.8% |
| Cajuns | 0.0 /100 | #322 | Tragic 41.0% |
| Sioux | 0.0 /100 | #323 | Tragic 41.0% |
| Cape Verdeans | 0.0 /100 | #324 | Tragic 41.3% |
| Cheyenne | 0.0 /100 | #325 | Tragic 41.3% |
| Immigrants | Cuba | 0.0 /100 | #326 | Tragic 41.5% |
| Tsimshian | 0.0 /100 | #327 | Tragic 42.2% |
| Immigrants | Cabo Verde | 0.0 /100 | #328 | Tragic 42.2% |