Immigrants from Cambodia vs Immigrants from Kazakhstan Single Father Households
COMPARE
Immigrants from Cambodia
Immigrants from Kazakhstan
Single Father Households
Single Father Households Comparison
Immigrants from Cambodia
Immigrants from Kazakhstan
2.7%
SINGLE FATHER HOUSEHOLDS
0.0/ 100
METRIC RATING
288th/ 347
METRIC RANK
2.0%
SINGLE FATHER HOUSEHOLDS
99.9/ 100
METRIC RATING
48th/ 347
METRIC RANK
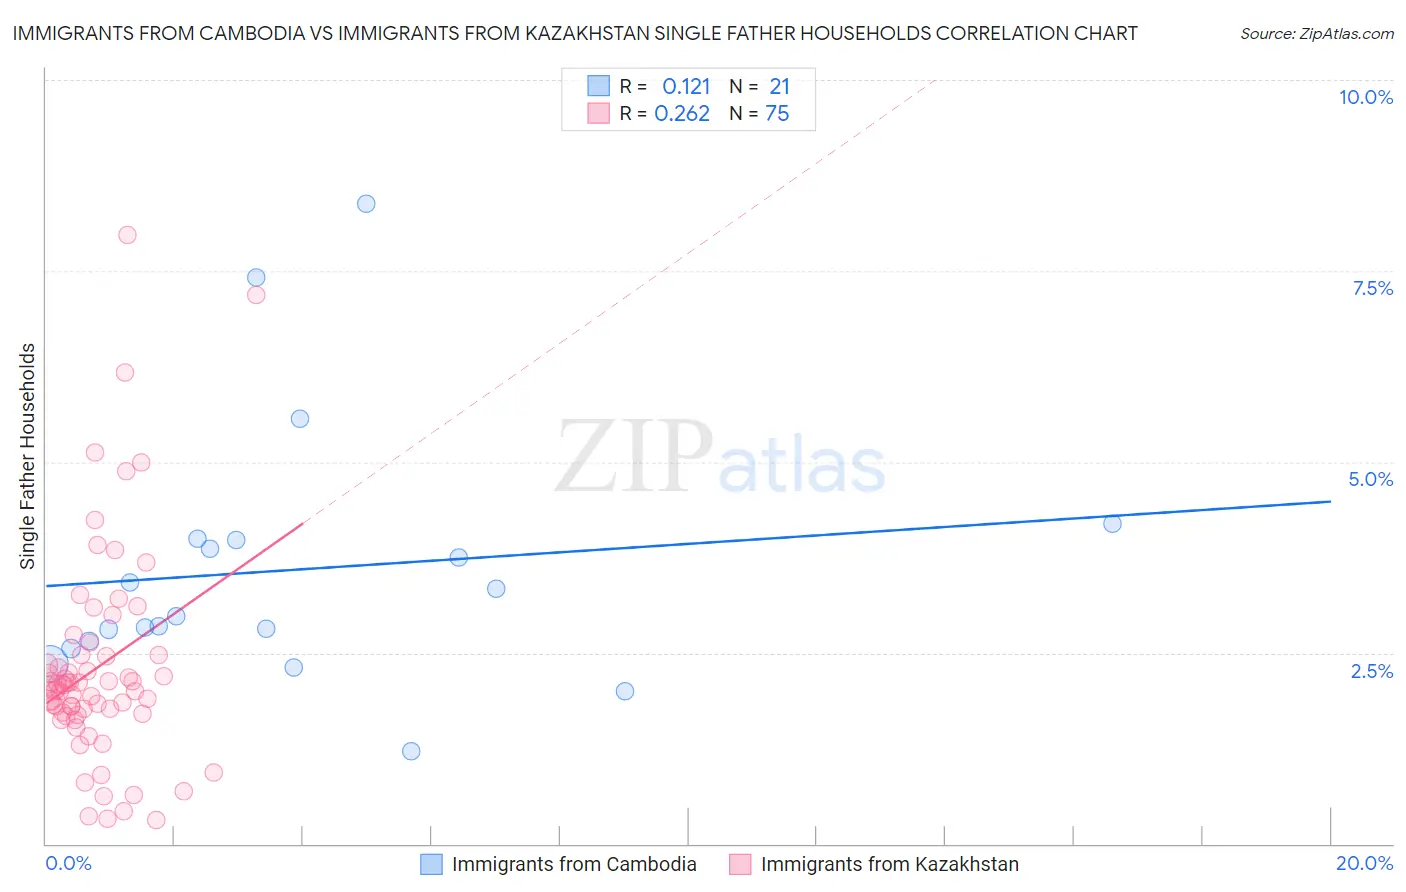
Immigrants from Cambodia vs Immigrants from Kazakhstan Single Father Households Correlation Chart
The statistical analysis conducted on geographies consisting of 204,669,929 people shows a poor positive correlation between the proportion of Immigrants from Cambodia and percentage of single father households in the United States with a correlation coefficient (R) of 0.121 and weighted average of 2.7%. Similarly, the statistical analysis conducted on geographies consisting of 124,033,053 people shows a weak positive correlation between the proportion of Immigrants from Kazakhstan and percentage of single father households in the United States with a correlation coefficient (R) of 0.262 and weighted average of 2.0%, a difference of 32.6%.
Single Father Households Correlation Summary
| Measurement | Immigrants from Cambodia | Immigrants from Kazakhstan |
| Minimum | 1.2% | 0.31% |
| Maximum | 8.4% | 8.0% |
| Range | 7.2% | 7.7% |
| Mean | 3.6% | 2.3% |
| Median | 3.0% | 2.1% |
| Interquartile 25% (IQ1) | 2.6% | 1.7% |
| Interquartile 75% (IQ3) | 4.0% | 2.5% |
| Interquartile Range (IQR) | 1.4% | 0.77% |
| Standard Deviation (Sample) | 1.7% | 1.4% |
| Standard Deviation (Population) | 1.7% | 1.4% |
Similar Demographics by Single Father Households
Demographics Similar to Immigrants from Cambodia by Single Father Households
In terms of single father households, the demographic groups most similar to Immigrants from Cambodia are Tlingit-Haida (2.7%, a difference of 0.060%), Central American Indian (2.7%, a difference of 0.25%), Immigrants from Cuba (2.7%, a difference of 0.40%), Ottawa (2.7%, a difference of 0.41%), and Hawaiian (2.7%, a difference of 0.50%).
| Demographics | Rating | Rank | Single Father Households |
| Nicaraguans | 0.1 /100 | #281 | Tragic 2.6% |
| Dutch West Indians | 0.1 /100 | #282 | Tragic 2.6% |
| Immigrants | Nicaragua | 0.1 /100 | #283 | Tragic 2.7% |
| Hawaiians | 0.1 /100 | #284 | Tragic 2.7% |
| Ottawa | 0.1 /100 | #285 | Tragic 2.7% |
| Immigrants | Cuba | 0.1 /100 | #286 | Tragic 2.7% |
| Central American Indians | 0.0 /100 | #287 | Tragic 2.7% |
| Immigrants | Cambodia | 0.0 /100 | #288 | Tragic 2.7% |
| Tlingit-Haida | 0.0 /100 | #289 | Tragic 2.7% |
| Puget Sound Salish | 0.0 /100 | #290 | Tragic 2.7% |
| Blackfeet | 0.0 /100 | #291 | Tragic 2.7% |
| Choctaw | 0.0 /100 | #292 | Tragic 2.7% |
| Immigrants | Fiji | 0.0 /100 | #293 | Tragic 2.7% |
| Malaysians | 0.0 /100 | #294 | Tragic 2.7% |
| Chickasaw | 0.0 /100 | #295 | Tragic 2.8% |
Demographics Similar to Immigrants from Kazakhstan by Single Father Households
In terms of single father households, the demographic groups most similar to Immigrants from Kazakhstan are Immigrants from Serbia (2.0%, a difference of 0.010%), Immigrants from Ukraine (2.0%, a difference of 0.020%), Immigrants from Switzerland (2.0%, a difference of 0.020%), Immigrants from Poland (2.0%, a difference of 0.020%), and Immigrants from Europe (2.0%, a difference of 0.26%).
| Demographics | Rating | Rank | Single Father Households |
| Immigrants | Turkey | 100.0 /100 | #41 | Exceptional 2.0% |
| Macedonians | 100.0 /100 | #42 | Exceptional 2.0% |
| Immigrants | Grenada | 100.0 /100 | #43 | Exceptional 2.0% |
| Latvians | 100.0 /100 | #44 | Exceptional 2.0% |
| Russians | 100.0 /100 | #45 | Exceptional 2.0% |
| Immigrants | Lebanon | 100.0 /100 | #46 | Exceptional 2.0% |
| Immigrants | Ukraine | 99.9 /100 | #47 | Exceptional 2.0% |
| Immigrants | Kazakhstan | 99.9 /100 | #48 | Exceptional 2.0% |
| Immigrants | Serbia | 99.9 /100 | #49 | Exceptional 2.0% |
| Immigrants | Switzerland | 99.9 /100 | #50 | Exceptional 2.0% |
| Immigrants | Poland | 99.9 /100 | #51 | Exceptional 2.0% |
| Immigrants | Europe | 99.9 /100 | #52 | Exceptional 2.0% |
| Immigrants | Northern Europe | 99.9 /100 | #53 | Exceptional 2.0% |
| Immigrants | Korea | 99.9 /100 | #54 | Exceptional 2.0% |
| Immigrants | France | 99.9 /100 | #55 | Exceptional 2.0% |