Immigrants from Cambodia vs Swedish Single Father Households
COMPARE
Immigrants from Cambodia
Swedish
Single Father Households
Single Father Households Comparison
Immigrants from Cambodia
Swedes
2.7%
SINGLE FATHER HOUSEHOLDS
0.0/ 100
METRIC RATING
288th/ 347
METRIC RANK
2.3%
SINGLE FATHER HOUSEHOLDS
61.6/ 100
METRIC RATING
171st/ 347
METRIC RANK
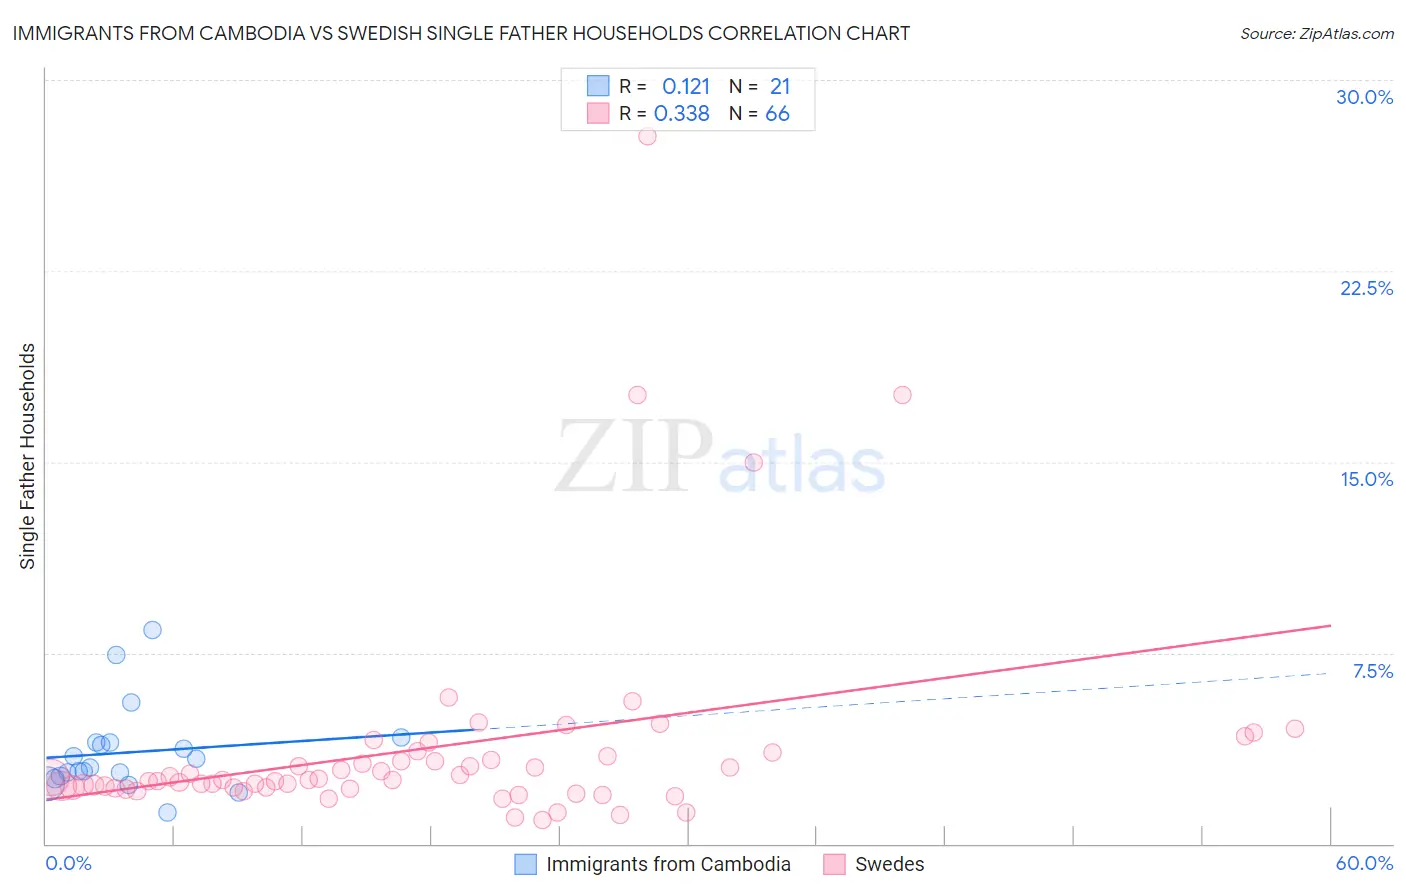
Immigrants from Cambodia vs Swedish Single Father Households Correlation Chart
The statistical analysis conducted on geographies consisting of 204,669,929 people shows a poor positive correlation between the proportion of Immigrants from Cambodia and percentage of single father households in the United States with a correlation coefficient (R) of 0.121 and weighted average of 2.7%. Similarly, the statistical analysis conducted on geographies consisting of 527,613,480 people shows a mild positive correlation between the proportion of Swedes and percentage of single father households in the United States with a correlation coefficient (R) of 0.338 and weighted average of 2.3%, a difference of 15.3%.
Single Father Households Correlation Summary
| Measurement | Immigrants from Cambodia | Swedish |
| Minimum | 1.2% | 0.93% |
| Maximum | 8.4% | 27.8% |
| Range | 7.2% | 26.8% |
| Mean | 3.6% | 3.8% |
| Median | 3.0% | 2.5% |
| Interquartile 25% (IQ1) | 2.6% | 2.2% |
| Interquartile 75% (IQ3) | 4.0% | 3.5% |
| Interquartile Range (IQR) | 1.4% | 1.3% |
| Standard Deviation (Sample) | 1.7% | 4.3% |
| Standard Deviation (Population) | 1.7% | 4.3% |
Similar Demographics by Single Father Households
Demographics Similar to Immigrants from Cambodia by Single Father Households
In terms of single father households, the demographic groups most similar to Immigrants from Cambodia are Tlingit-Haida (2.7%, a difference of 0.060%), Central American Indian (2.7%, a difference of 0.25%), Immigrants from Cuba (2.7%, a difference of 0.40%), Ottawa (2.7%, a difference of 0.41%), and Hawaiian (2.7%, a difference of 0.50%).
| Demographics | Rating | Rank | Single Father Households |
| Nicaraguans | 0.1 /100 | #281 | Tragic 2.6% |
| Dutch West Indians | 0.1 /100 | #282 | Tragic 2.6% |
| Immigrants | Nicaragua | 0.1 /100 | #283 | Tragic 2.7% |
| Hawaiians | 0.1 /100 | #284 | Tragic 2.7% |
| Ottawa | 0.1 /100 | #285 | Tragic 2.7% |
| Immigrants | Cuba | 0.1 /100 | #286 | Tragic 2.7% |
| Central American Indians | 0.0 /100 | #287 | Tragic 2.7% |
| Immigrants | Cambodia | 0.0 /100 | #288 | Tragic 2.7% |
| Tlingit-Haida | 0.0 /100 | #289 | Tragic 2.7% |
| Puget Sound Salish | 0.0 /100 | #290 | Tragic 2.7% |
| Blackfeet | 0.0 /100 | #291 | Tragic 2.7% |
| Choctaw | 0.0 /100 | #292 | Tragic 2.7% |
| Immigrants | Fiji | 0.0 /100 | #293 | Tragic 2.7% |
| Malaysians | 0.0 /100 | #294 | Tragic 2.7% |
| Chickasaw | 0.0 /100 | #295 | Tragic 2.8% |
Demographics Similar to Swedes by Single Father Households
In terms of single father households, the demographic groups most similar to Swedes are Ugandan (2.3%, a difference of 0.050%), Czech (2.3%, a difference of 0.070%), Icelander (2.3%, a difference of 0.12%), South American (2.3%, a difference of 0.21%), and Czechoslovakian (2.3%, a difference of 0.21%).
| Demographics | Rating | Rank | Single Father Households |
| Pakistanis | 70.6 /100 | #164 | Good 2.3% |
| Scotch-Irish | 69.4 /100 | #165 | Good 2.3% |
| English | 68.6 /100 | #166 | Good 2.3% |
| South Americans | 64.3 /100 | #167 | Good 2.3% |
| Icelanders | 63.1 /100 | #168 | Good 2.3% |
| Czechs | 62.5 /100 | #169 | Good 2.3% |
| Ugandans | 62.2 /100 | #170 | Good 2.3% |
| Swedes | 61.6 /100 | #171 | Good 2.3% |
| Czechoslovakians | 58.9 /100 | #172 | Average 2.3% |
| Celtics | 55.4 /100 | #173 | Average 2.3% |
| Afghans | 50.0 /100 | #174 | Average 2.3% |
| Immigrants | Jamaica | 49.1 /100 | #175 | Average 2.3% |
| Danes | 48.2 /100 | #176 | Average 2.3% |
| Colombians | 48.0 /100 | #177 | Average 2.3% |
| Costa Ricans | 44.1 /100 | #178 | Average 2.3% |