Immigrants from Bulgaria vs Sioux Currently Married
COMPARE
Immigrants from Bulgaria
Sioux
Currently Married
Currently Married Comparison
Immigrants from Bulgaria
Sioux
47.9%
CURRENTLY MARRIED
94.8/ 100
METRIC RATING
95th/ 347
METRIC RANK
41.9%
CURRENTLY MARRIED
0.0/ 100
METRIC RATING
303rd/ 347
METRIC RANK
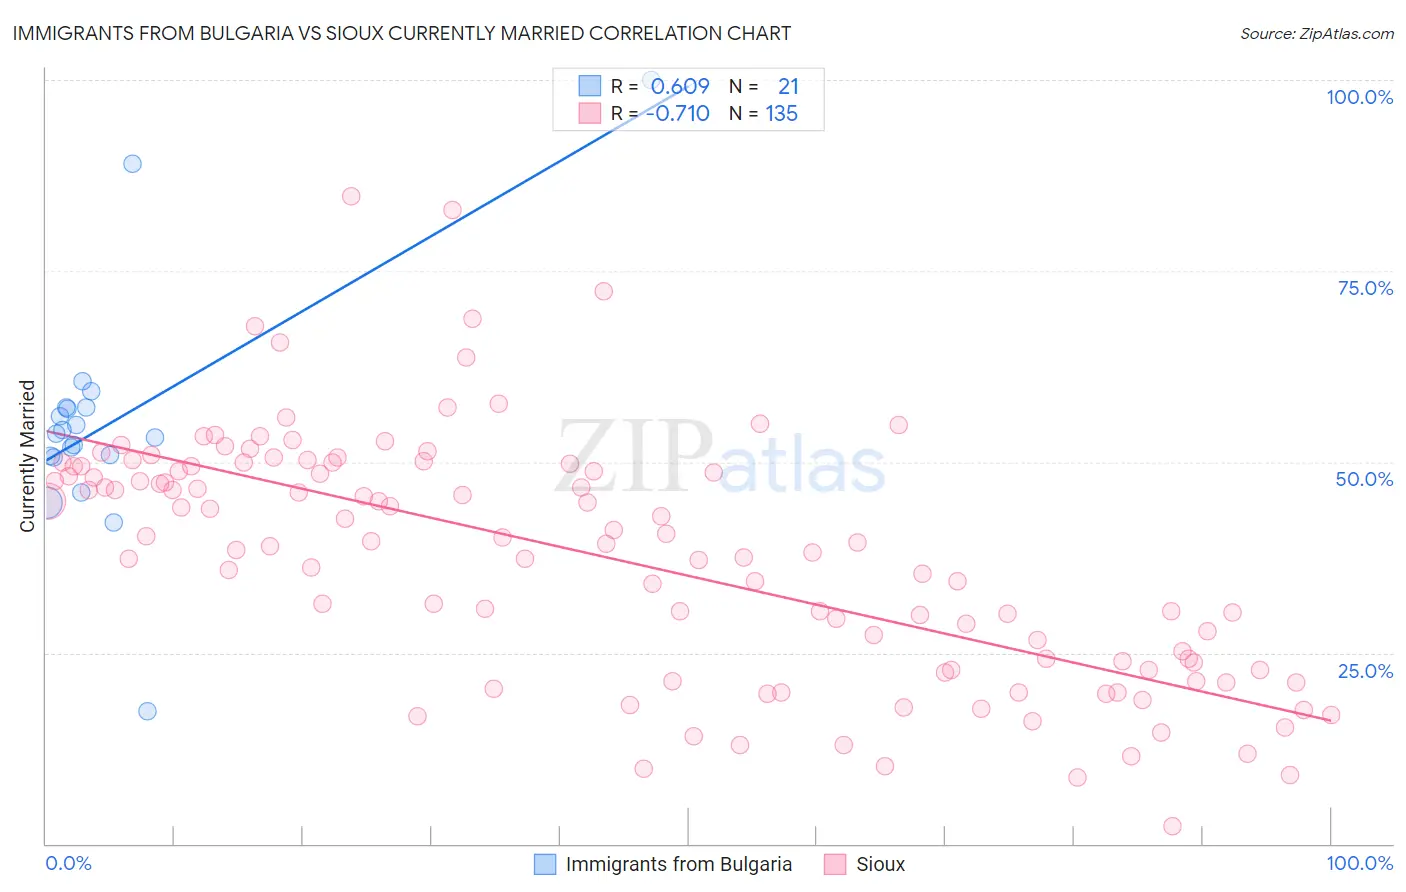
Immigrants from Bulgaria vs Sioux Currently Married Correlation Chart
The statistical analysis conducted on geographies consisting of 172,548,361 people shows a significant positive correlation between the proportion of Immigrants from Bulgaria and percentage of population currently married in the United States with a correlation coefficient (R) of 0.609 and weighted average of 47.9%. Similarly, the statistical analysis conducted on geographies consisting of 234,188,920 people shows a strong negative correlation between the proportion of Sioux and percentage of population currently married in the United States with a correlation coefficient (R) of -0.710 and weighted average of 41.9%, a difference of 14.1%.
Currently Married Correlation Summary
| Measurement | Immigrants from Bulgaria | Sioux |
| Minimum | 17.4% | 2.3% |
| Maximum | 100.0% | 84.8% |
| Range | 82.6% | 82.5% |
| Mean | 55.2% | 37.5% |
| Median | 53.7% | 39.4% |
| Interquartile 25% (IQ1) | 50.7% | 22.8% |
| Interquartile 75% (IQ3) | 57.1% | 49.5% |
| Interquartile Range (IQR) | 6.4% | 26.7% |
| Standard Deviation (Sample) | 16.0% | 16.0% |
| Standard Deviation (Population) | 15.6% | 16.0% |
Similar Demographics by Currently Married
Demographics Similar to Immigrants from Bulgaria by Currently Married
In terms of currently married, the demographic groups most similar to Immigrants from Bulgaria are Egyptian (47.9%, a difference of 0.0%), Immigrants from Ukraine (47.9%, a difference of 0.010%), Immigrants from China (47.9%, a difference of 0.020%), Native Hawaiian (47.9%, a difference of 0.040%), and Lebanese (47.9%, a difference of 0.050%).
| Demographics | Rating | Rank | Currently Married |
| Immigrants | Eastern Europe | 96.1 /100 | #88 | Exceptional 48.0% |
| Indians (Asian) | 95.8 /100 | #89 | Exceptional 48.0% |
| Americans | 95.7 /100 | #90 | Exceptional 48.0% |
| Immigrants | Bolivia | 95.6 /100 | #91 | Exceptional 47.9% |
| Koreans | 95.4 /100 | #92 | Exceptional 47.9% |
| Lebanese | 95.1 /100 | #93 | Exceptional 47.9% |
| Native Hawaiians | 95.0 /100 | #94 | Exceptional 47.9% |
| Immigrants | Bulgaria | 94.8 /100 | #95 | Exceptional 47.9% |
| Egyptians | 94.8 /100 | #96 | Exceptional 47.9% |
| Immigrants | Ukraine | 94.8 /100 | #97 | Exceptional 47.9% |
| Immigrants | China | 94.7 /100 | #98 | Exceptional 47.9% |
| Immigrants | Sweden | 94.3 /100 | #99 | Exceptional 47.8% |
| Celtics | 94.2 /100 | #100 | Exceptional 47.8% |
| Immigrants | Germany | 94.1 /100 | #101 | Exceptional 47.8% |
| Turks | 93.9 /100 | #102 | Exceptional 47.8% |
Demographics Similar to Sioux by Currently Married
In terms of currently married, the demographic groups most similar to Sioux are Immigrants from Zaire (42.0%, a difference of 0.010%), Immigrants from Bahamas (41.9%, a difference of 0.11%), Immigrants from Trinidad and Tobago (41.9%, a difference of 0.15%), Immigrants from Guyana (41.9%, a difference of 0.16%), and Immigrants from Yemen (42.1%, a difference of 0.26%).
| Demographics | Rating | Rank | Currently Married |
| Menominee | 0.0 /100 | #296 | Tragic 42.3% |
| Cheyenne | 0.0 /100 | #297 | Tragic 42.2% |
| Immigrants | Honduras | 0.0 /100 | #298 | Tragic 42.2% |
| Liberians | 0.0 /100 | #299 | Tragic 42.2% |
| Belizeans | 0.0 /100 | #300 | Tragic 42.2% |
| Immigrants | Yemen | 0.0 /100 | #301 | Tragic 42.1% |
| Immigrants | Zaire | 0.0 /100 | #302 | Tragic 42.0% |
| Sioux | 0.0 /100 | #303 | Tragic 41.9% |
| Immigrants | Bahamas | 0.0 /100 | #304 | Tragic 41.9% |
| Immigrants | Trinidad and Tobago | 0.0 /100 | #305 | Tragic 41.9% |
| Immigrants | Guyana | 0.0 /100 | #306 | Tragic 41.9% |
| Africans | 0.0 /100 | #307 | Tragic 41.8% |
| Immigrants | Belize | 0.0 /100 | #308 | Tragic 41.8% |
| Immigrants | Liberia | 0.0 /100 | #309 | Tragic 41.8% |
| Guyanese | 0.0 /100 | #310 | Tragic 41.6% |