Immigrants from Barbados vs Lebanese Single Father Households
COMPARE
Immigrants from Barbados
Lebanese
Single Father Households
Single Father Households Comparison
Immigrants from Barbados
Lebanese
2.2%
SINGLE FATHER HOUSEHOLDS
98.2/ 100
METRIC RATING
115th/ 347
METRIC RANK
2.1%
SINGLE FATHER HOUSEHOLDS
98.9/ 100
METRIC RATING
103rd/ 347
METRIC RANK
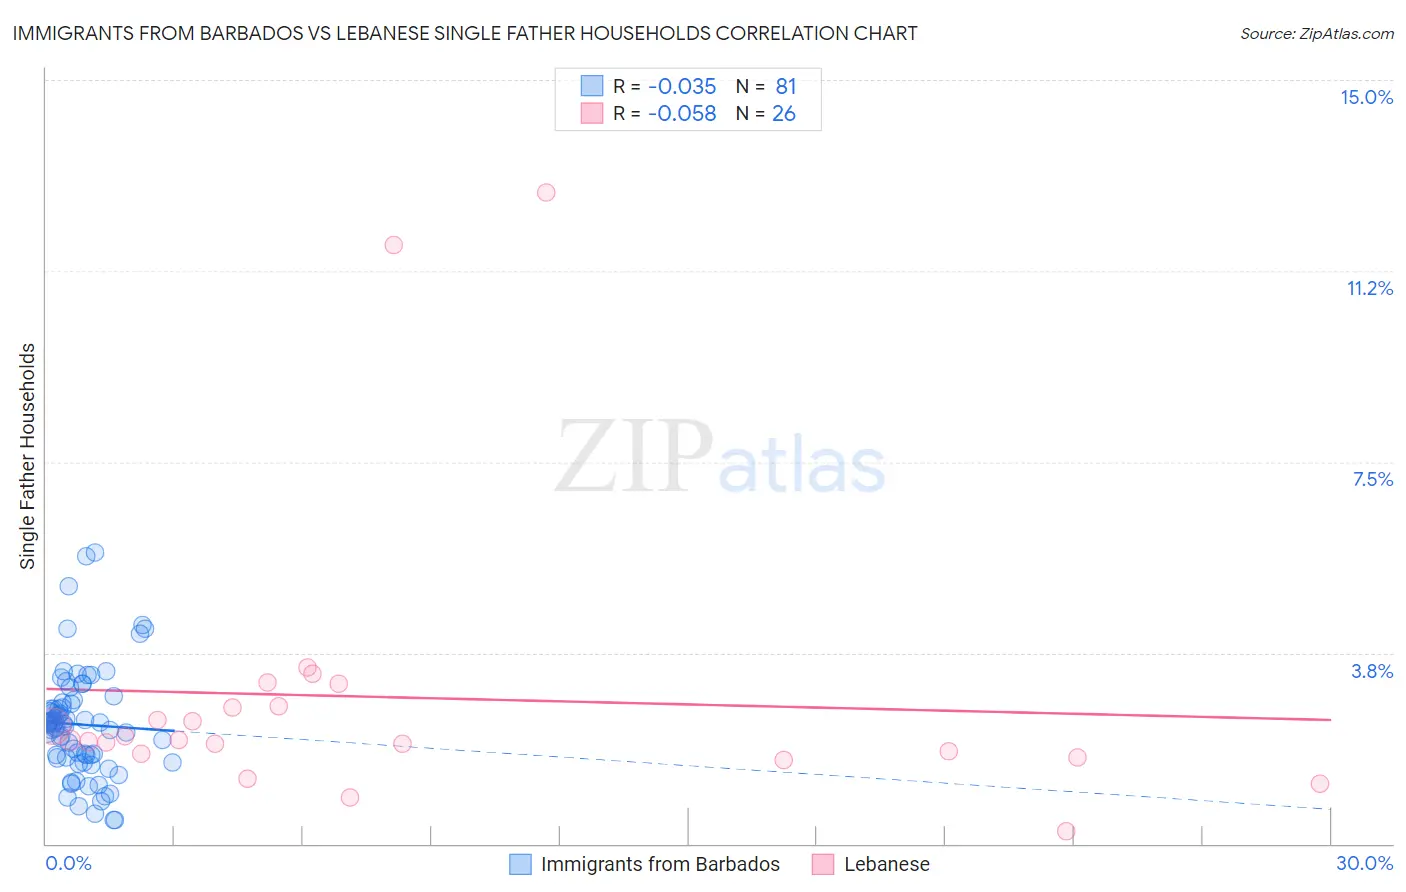
Immigrants from Barbados vs Lebanese Single Father Households Correlation Chart
The statistical analysis conducted on geographies consisting of 112,598,032 people shows no correlation between the proportion of Immigrants from Barbados and percentage of single father households in the United States with a correlation coefficient (R) of -0.035 and weighted average of 2.2%. Similarly, the statistical analysis conducted on geographies consisting of 397,908,440 people shows a slight negative correlation between the proportion of Lebanese and percentage of single father households in the United States with a correlation coefficient (R) of -0.058 and weighted average of 2.1%, a difference of 1.0%.
Single Father Households Correlation Summary
| Measurement | Immigrants from Barbados | Lebanese |
| Minimum | 0.46% | 0.25% |
| Maximum | 5.7% | 12.8% |
| Range | 5.3% | 12.5% |
| Mean | 2.3% | 2.9% |
| Median | 2.4% | 2.0% |
| Interquartile 25% (IQ1) | 1.7% | 1.8% |
| Interquartile 75% (IQ3) | 2.8% | 2.7% |
| Interquartile Range (IQR) | 1.1% | 0.94% |
| Standard Deviation (Sample) | 1.1% | 2.9% |
| Standard Deviation (Population) | 1.0% | 2.8% |
Demographics Similar to Immigrants from Barbados and Lebanese by Single Father Households
In terms of single father households, the demographic groups most similar to Immigrants from Barbados are Immigrants from North America (2.2%, a difference of 0.030%), Immigrants from Argentina (2.2%, a difference of 0.030%), Iraqi (2.2%, a difference of 0.070%), Immigrants from Trinidad and Tobago (2.2%, a difference of 0.090%), and Immigrants from Canada (2.2%, a difference of 0.12%). Similarly, the demographic groups most similar to Lebanese are Argentinean (2.1%, a difference of 0.020%), Alsatian (2.1%, a difference of 0.020%), Immigrants from Western Europe (2.1%, a difference of 0.050%), Immigrants from Northern Africa (2.1%, a difference of 0.20%), and South African (2.1%, a difference of 0.35%).
| Demographics | Rating | Rank | Single Father Households |
| South Africans | 99.1 /100 | #99 | Exceptional 2.1% |
| Immigrants | Northern Africa | 99.0 /100 | #100 | Exceptional 2.1% |
| Immigrants | Western Europe | 98.9 /100 | #101 | Exceptional 2.1% |
| Argentineans | 98.9 /100 | #102 | Exceptional 2.1% |
| Lebanese | 98.9 /100 | #103 | Exceptional 2.1% |
| Alsatians | 98.9 /100 | #104 | Exceptional 2.1% |
| Palestinians | 98.6 /100 | #105 | Exceptional 2.2% |
| Immigrants | Southern Europe | 98.6 /100 | #106 | Exceptional 2.2% |
| Slovenes | 98.5 /100 | #107 | Exceptional 2.2% |
| Immigrants | Netherlands | 98.5 /100 | #108 | Exceptional 2.2% |
| Barbadians | 98.4 /100 | #109 | Exceptional 2.2% |
| Italians | 98.3 /100 | #110 | Exceptional 2.2% |
| Immigrants | Canada | 98.3 /100 | #111 | Exceptional 2.2% |
| Immigrants | Trinidad and Tobago | 98.2 /100 | #112 | Exceptional 2.2% |
| Iraqis | 98.2 /100 | #113 | Exceptional 2.2% |
| Immigrants | North America | 98.2 /100 | #114 | Exceptional 2.2% |
| Immigrants | Barbados | 98.2 /100 | #115 | Exceptional 2.2% |
| Immigrants | Argentina | 98.1 /100 | #116 | Exceptional 2.2% |
| Hungarians | 97.9 /100 | #117 | Exceptional 2.2% |
| Immigrants | Morocco | 97.8 /100 | #118 | Exceptional 2.2% |
| Trinidadians and Tobagonians | 97.8 /100 | #119 | Exceptional 2.2% |