Immigrants from Barbados vs Immigrants from Peru Single Father Households
COMPARE
Immigrants from Barbados
Immigrants from Peru
Single Father Households
Single Father Households Comparison
Immigrants from Barbados
Immigrants from Peru
2.2%
SINGLE FATHER HOUSEHOLDS
98.2/ 100
METRIC RATING
115th/ 347
METRIC RANK
2.4%
SINGLE FATHER HOUSEHOLDS
19.3/ 100
METRIC RATING
209th/ 347
METRIC RANK
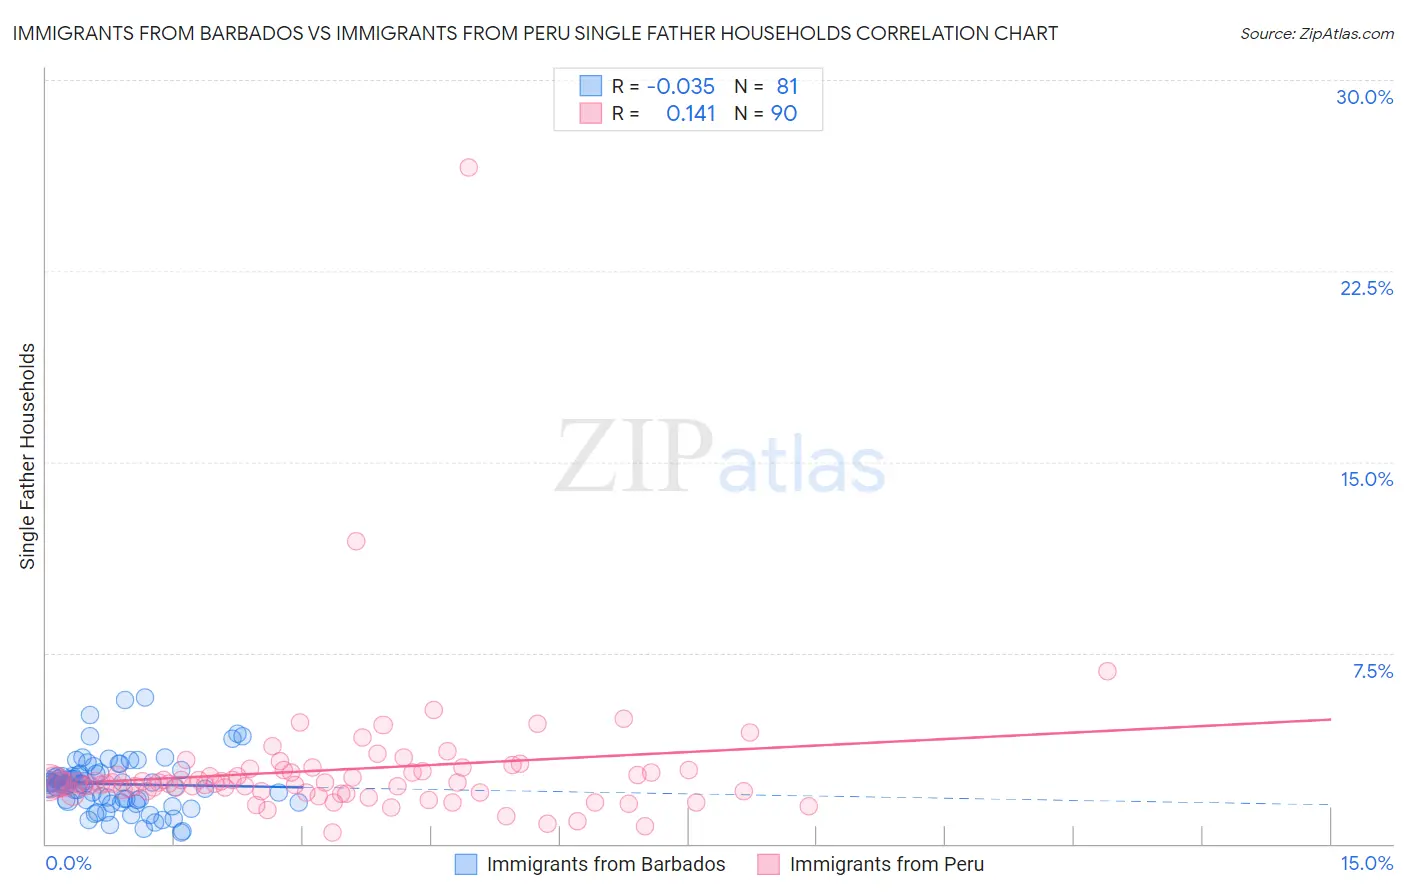
Immigrants from Barbados vs Immigrants from Peru Single Father Households Correlation Chart
The statistical analysis conducted on geographies consisting of 112,598,032 people shows no correlation between the proportion of Immigrants from Barbados and percentage of single father households in the United States with a correlation coefficient (R) of -0.035 and weighted average of 2.2%. Similarly, the statistical analysis conducted on geographies consisting of 326,923,065 people shows a poor positive correlation between the proportion of Immigrants from Peru and percentage of single father households in the United States with a correlation coefficient (R) of 0.141 and weighted average of 2.4%, a difference of 10.7%.
Single Father Households Correlation Summary
| Measurement | Immigrants from Barbados | Immigrants from Peru |
| Minimum | 0.46% | 0.45% |
| Maximum | 5.7% | 26.6% |
| Range | 5.3% | 26.1% |
| Mean | 2.3% | 2.9% |
| Median | 2.4% | 2.4% |
| Interquartile 25% (IQ1) | 1.7% | 2.0% |
| Interquartile 75% (IQ3) | 2.8% | 2.9% |
| Interquartile Range (IQR) | 1.1% | 0.84% |
| Standard Deviation (Sample) | 1.1% | 2.9% |
| Standard Deviation (Population) | 1.0% | 2.9% |
Similar Demographics by Single Father Households
Demographics Similar to Immigrants from Barbados by Single Father Households
In terms of single father households, the demographic groups most similar to Immigrants from Barbados are Immigrants from North America (2.2%, a difference of 0.030%), Immigrants from Argentina (2.2%, a difference of 0.030%), Iraqi (2.2%, a difference of 0.070%), Immigrants from Trinidad and Tobago (2.2%, a difference of 0.090%), and Immigrants from Canada (2.2%, a difference of 0.12%).
| Demographics | Rating | Rank | Single Father Households |
| Immigrants | Netherlands | 98.5 /100 | #108 | Exceptional 2.2% |
| Barbadians | 98.4 /100 | #109 | Exceptional 2.2% |
| Italians | 98.3 /100 | #110 | Exceptional 2.2% |
| Immigrants | Canada | 98.3 /100 | #111 | Exceptional 2.2% |
| Immigrants | Trinidad and Tobago | 98.2 /100 | #112 | Exceptional 2.2% |
| Iraqis | 98.2 /100 | #113 | Exceptional 2.2% |
| Immigrants | North America | 98.2 /100 | #114 | Exceptional 2.2% |
| Immigrants | Barbados | 98.2 /100 | #115 | Exceptional 2.2% |
| Immigrants | Argentina | 98.1 /100 | #116 | Exceptional 2.2% |
| Hungarians | 97.9 /100 | #117 | Exceptional 2.2% |
| Immigrants | Morocco | 97.8 /100 | #118 | Exceptional 2.2% |
| Trinidadians and Tobagonians | 97.8 /100 | #119 | Exceptional 2.2% |
| Australians | 97.7 /100 | #120 | Exceptional 2.2% |
| Immigrants | Brazil | 97.7 /100 | #121 | Exceptional 2.2% |
| Immigrants | Iraq | 97.6 /100 | #122 | Exceptional 2.2% |
Demographics Similar to Immigrants from Peru by Single Father Households
In terms of single father households, the demographic groups most similar to Immigrants from Peru are Immigrants from Costa Rica (2.4%, a difference of 0.010%), Immigrants from Nigeria (2.4%, a difference of 0.060%), Finnish (2.4%, a difference of 0.11%), Immigrants from Kenya (2.4%, a difference of 0.12%), and Norwegian (2.4%, a difference of 0.26%).
| Demographics | Rating | Rank | Single Father Households |
| German Russians | 25.7 /100 | #202 | Fair 2.4% |
| French Canadians | 24.7 /100 | #203 | Fair 2.4% |
| Ecuadorians | 24.5 /100 | #204 | Fair 2.4% |
| Immigrants | Afghanistan | 24.2 /100 | #205 | Fair 2.4% |
| Koreans | 24.1 /100 | #206 | Fair 2.4% |
| Whites/Caucasians | 22.6 /100 | #207 | Fair 2.4% |
| Immigrants | Kenya | 20.3 /100 | #208 | Fair 2.4% |
| Immigrants | Peru | 19.3 /100 | #209 | Poor 2.4% |
| Immigrants | Costa Rica | 19.2 /100 | #210 | Poor 2.4% |
| Immigrants | Nigeria | 18.7 /100 | #211 | Poor 2.4% |
| Finns | 18.3 /100 | #212 | Poor 2.4% |
| Norwegians | 17.1 /100 | #213 | Poor 2.4% |
| Ethiopians | 16.6 /100 | #214 | Poor 2.4% |
| Immigrants | South Eastern Asia | 15.9 /100 | #215 | Poor 2.4% |
| Immigrants | Ecuador | 14.9 /100 | #216 | Poor 2.4% |