Immigrants from Vietnam vs Lebanese Single Father Households
COMPARE
Immigrants from Vietnam
Lebanese
Single Father Households
Single Father Households Comparison
Immigrants from Vietnam
Lebanese
2.4%
SINGLE FATHER HOUSEHOLDS
27.1/ 100
METRIC RATING
199th/ 347
METRIC RANK
2.1%
SINGLE FATHER HOUSEHOLDS
98.9/ 100
METRIC RATING
103rd/ 347
METRIC RANK
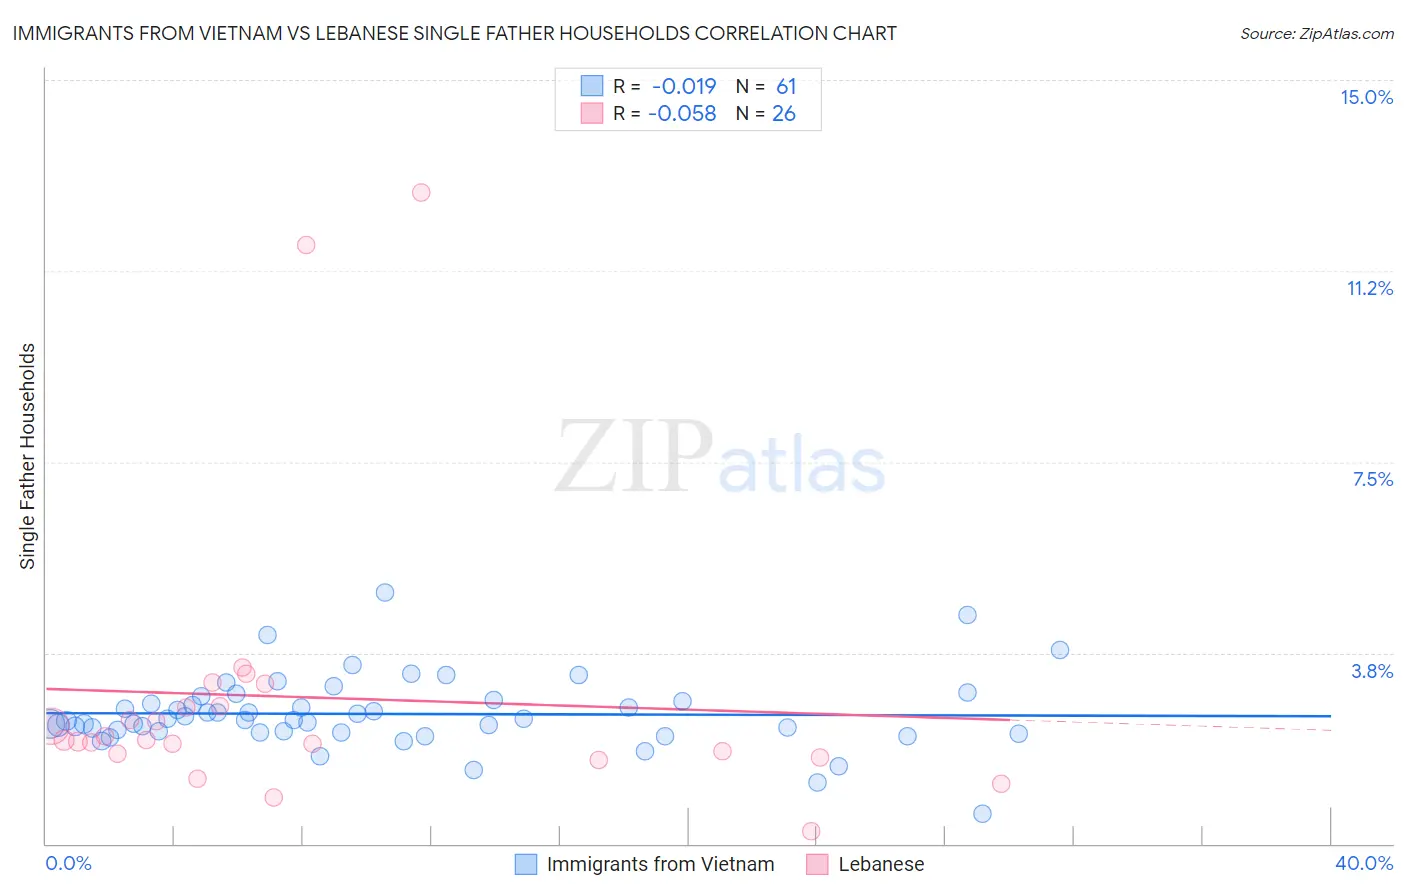
Immigrants from Vietnam vs Lebanese Single Father Households Correlation Chart
The statistical analysis conducted on geographies consisting of 401,755,034 people shows no correlation between the proportion of Immigrants from Vietnam and percentage of single father households in the United States with a correlation coefficient (R) of -0.019 and weighted average of 2.4%. Similarly, the statistical analysis conducted on geographies consisting of 397,908,440 people shows a slight negative correlation between the proportion of Lebanese and percentage of single father households in the United States with a correlation coefficient (R) of -0.058 and weighted average of 2.1%, a difference of 11.0%.
Single Father Households Correlation Summary
| Measurement | Immigrants from Vietnam | Lebanese |
| Minimum | 0.60% | 0.25% |
| Maximum | 4.9% | 12.8% |
| Range | 4.3% | 12.5% |
| Mean | 2.5% | 2.9% |
| Median | 2.4% | 2.0% |
| Interquartile 25% (IQ1) | 2.2% | 1.8% |
| Interquartile 75% (IQ3) | 2.8% | 2.7% |
| Interquartile Range (IQR) | 0.62% | 0.94% |
| Standard Deviation (Sample) | 0.70% | 2.9% |
| Standard Deviation (Population) | 0.70% | 2.8% |
Similar Demographics by Single Father Households
Demographics Similar to Immigrants from Vietnam by Single Father Households
In terms of single father households, the demographic groups most similar to Immigrants from Vietnam are Peruvian (2.4%, a difference of 0.0%), Scandinavian (2.4%, a difference of 0.030%), Kenyan (2.4%, a difference of 0.080%), German (2.4%, a difference of 0.080%), and Immigrants from Uganda (2.4%, a difference of 0.10%).
| Demographics | Rating | Rank | Single Father Households |
| Immigrants | Sudan | 29.8 /100 | #192 | Fair 2.4% |
| Uruguayans | 29.7 /100 | #193 | Fair 2.4% |
| Panamanians | 29.6 /100 | #194 | Fair 2.4% |
| Immigrants | Philippines | 28.7 /100 | #195 | Fair 2.4% |
| Kenyans | 28.0 /100 | #196 | Fair 2.4% |
| Germans | 28.0 /100 | #197 | Fair 2.4% |
| Scandinavians | 27.4 /100 | #198 | Fair 2.4% |
| Immigrants | Vietnam | 27.1 /100 | #199 | Fair 2.4% |
| Peruvians | 27.1 /100 | #200 | Fair 2.4% |
| Immigrants | Uganda | 26.0 /100 | #201 | Fair 2.4% |
| German Russians | 25.7 /100 | #202 | Fair 2.4% |
| French Canadians | 24.7 /100 | #203 | Fair 2.4% |
| Ecuadorians | 24.5 /100 | #204 | Fair 2.4% |
| Immigrants | Afghanistan | 24.2 /100 | #205 | Fair 2.4% |
| Koreans | 24.1 /100 | #206 | Fair 2.4% |
Demographics Similar to Lebanese by Single Father Households
In terms of single father households, the demographic groups most similar to Lebanese are Argentinean (2.1%, a difference of 0.020%), Alsatian (2.1%, a difference of 0.020%), Immigrants from Western Europe (2.1%, a difference of 0.050%), Immigrants from Northern Africa (2.1%, a difference of 0.20%), and South African (2.1%, a difference of 0.35%).
| Demographics | Rating | Rank | Single Father Households |
| Arabs | 99.2 /100 | #96 | Exceptional 2.1% |
| Immigrants | Moldova | 99.1 /100 | #97 | Exceptional 2.1% |
| Guyanese | 99.1 /100 | #98 | Exceptional 2.1% |
| South Africans | 99.1 /100 | #99 | Exceptional 2.1% |
| Immigrants | Northern Africa | 99.0 /100 | #100 | Exceptional 2.1% |
| Immigrants | Western Europe | 98.9 /100 | #101 | Exceptional 2.1% |
| Argentineans | 98.9 /100 | #102 | Exceptional 2.1% |
| Lebanese | 98.9 /100 | #103 | Exceptional 2.1% |
| Alsatians | 98.9 /100 | #104 | Exceptional 2.1% |
| Palestinians | 98.6 /100 | #105 | Exceptional 2.2% |
| Immigrants | Southern Europe | 98.6 /100 | #106 | Exceptional 2.2% |
| Slovenes | 98.5 /100 | #107 | Exceptional 2.2% |
| Immigrants | Netherlands | 98.5 /100 | #108 | Exceptional 2.2% |
| Barbadians | 98.4 /100 | #109 | Exceptional 2.2% |
| Italians | 98.3 /100 | #110 | Exceptional 2.2% |