Colombian vs Immigrants from West Indies Average Family Size
COMPARE
Colombian
Immigrants from West Indies
Average Family Size
Average Family Size Comparison
Colombians
Immigrants from West Indies
3.26
AVERAGE FAMILY SIZE
89.9/ 100
METRIC RATING
128th/ 347
METRIC RANK
3.33
AVERAGE FAMILY SIZE
99.9/ 100
METRIC RATING
71st/ 347
METRIC RANK
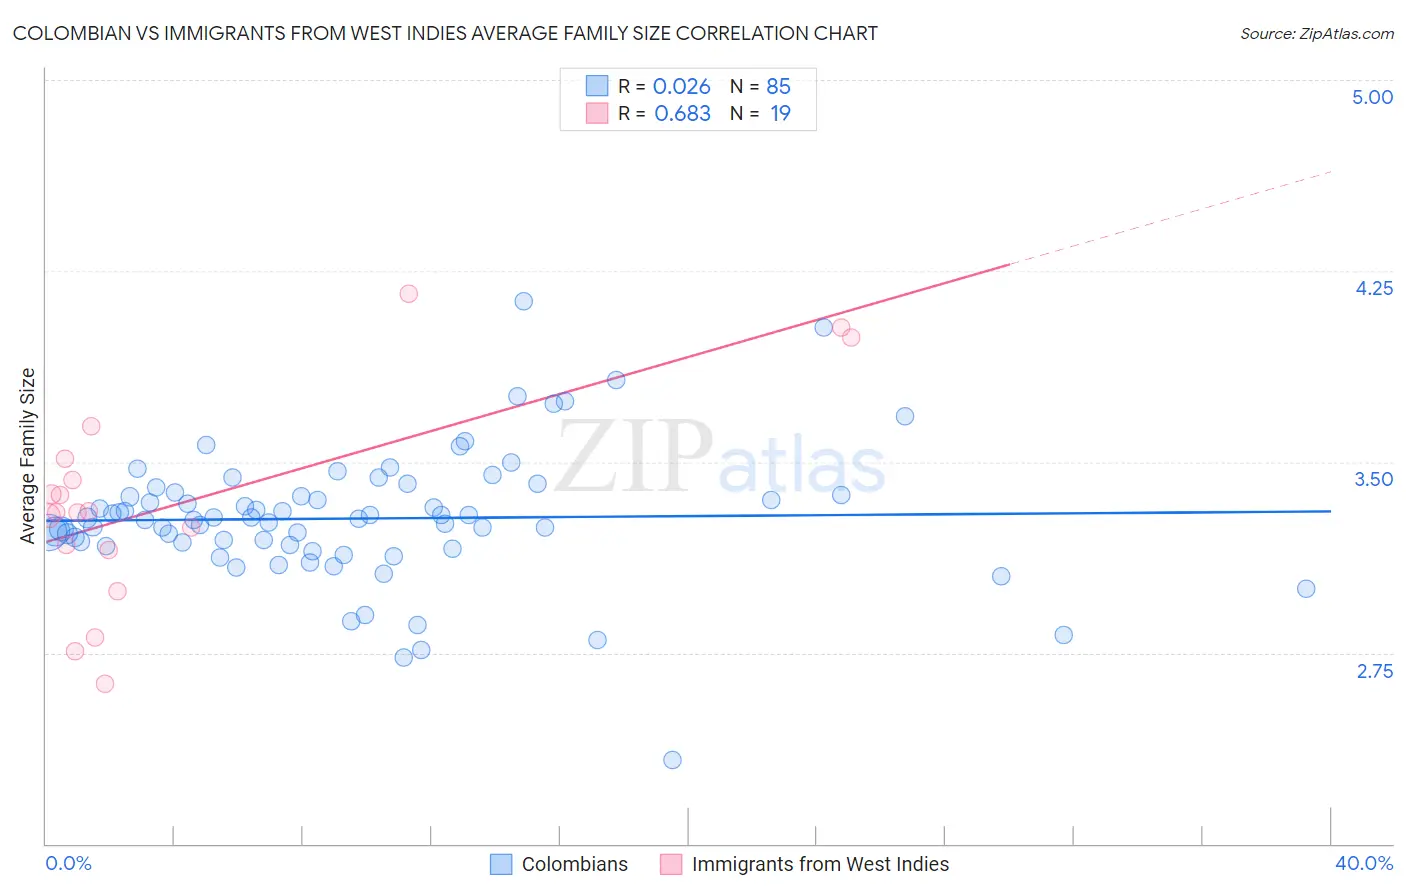
Colombian vs Immigrants from West Indies Average Family Size Correlation Chart
The statistical analysis conducted on geographies consisting of 419,324,295 people shows no correlation between the proportion of Colombians and average family size in the United States with a correlation coefficient (R) of 0.026 and weighted average of 3.26. Similarly, the statistical analysis conducted on geographies consisting of 72,454,628 people shows a significant positive correlation between the proportion of Immigrants from West Indies and average family size in the United States with a correlation coefficient (R) of 0.683 and weighted average of 3.33, a difference of 2.1%.
Average Family Size Correlation Summary
| Measurement | Colombian | Immigrants from West Indies |
| Minimum | 2.33 | 2.63 |
| Maximum | 4.13 | 4.16 |
| Range | 1.80 | 1.53 |
| Mean | 3.28 | 3.34 |
| Median | 3.28 | 3.30 |
| Interquartile 25% (IQ1) | 3.17 | 3.15 |
| Interquartile 75% (IQ3) | 3.37 | 3.51 |
| Interquartile Range (IQR) | 0.20 | 0.36 |
| Standard Deviation (Sample) | 0.26 | 0.41 |
| Standard Deviation (Population) | 0.26 | 0.40 |
Similar Demographics by Average Family Size
Demographics Similar to Colombians by Average Family Size
In terms of average family size, the demographic groups most similar to Colombians are Immigrants from Costa Rica (3.26, a difference of 0.040%), Immigrants from Syria (3.26, a difference of 0.040%), Immigrants from Hong Kong (3.26, a difference of 0.060%), Laotian (3.26, a difference of 0.060%), and Immigrants from Cuba (3.26, a difference of 0.080%).
| Demographics | Rating | Rank | Average Family Size |
| Immigrants | Thailand | 93.3 /100 | #121 | Exceptional 3.27 |
| Immigrants | Colombia | 92.8 /100 | #122 | Exceptional 3.27 |
| Alaskan Athabascans | 92.4 /100 | #123 | Exceptional 3.27 |
| South American Indians | 91.6 /100 | #124 | Exceptional 3.26 |
| Immigrants | Cuba | 91.3 /100 | #125 | Exceptional 3.26 |
| Immigrants | Costa Rica | 90.7 /100 | #126 | Exceptional 3.26 |
| Immigrants | Syria | 90.6 /100 | #127 | Exceptional 3.26 |
| Colombians | 89.9 /100 | #128 | Excellent 3.26 |
| Immigrants | Hong Kong | 88.6 /100 | #129 | Excellent 3.26 |
| Laotians | 88.5 /100 | #130 | Excellent 3.26 |
| Immigrants | Western Asia | 87.7 /100 | #131 | Excellent 3.26 |
| Costa Ricans | 86.8 /100 | #132 | Excellent 3.26 |
| Immigrants | Venezuela | 86.3 /100 | #133 | Excellent 3.26 |
| Africans | 84.9 /100 | #134 | Excellent 3.25 |
| Panamanians | 84.2 /100 | #135 | Excellent 3.25 |
Demographics Similar to Immigrants from West Indies by Average Family Size
In terms of average family size, the demographic groups most similar to Immigrants from West Indies are Immigrants from Trinidad and Tobago (3.33, a difference of 0.010%), Immigrants (3.33, a difference of 0.060%), Immigrants from Caribbean (3.33, a difference of 0.070%), Immigrants from Cambodia (3.33, a difference of 0.090%), and Yaqui (3.32, a difference of 0.10%).
| Demographics | Rating | Rank | Average Family Size |
| Dominicans | 99.9 /100 | #64 | Exceptional 3.34 |
| Immigrants | Laos | 99.9 /100 | #65 | Exceptional 3.34 |
| Immigrants | St. Vincent and the Grenadines | 99.9 /100 | #66 | Exceptional 3.34 |
| Immigrants | Jamaica | 99.9 /100 | #67 | Exceptional 3.33 |
| Immigrants | Cambodia | 99.9 /100 | #68 | Exceptional 3.33 |
| Immigrants | Immigrants | 99.9 /100 | #69 | Exceptional 3.33 |
| Immigrants | Trinidad and Tobago | 99.9 /100 | #70 | Exceptional 3.33 |
| Immigrants | West Indies | 99.9 /100 | #71 | Exceptional 3.33 |
| Immigrants | Caribbean | 99.9 /100 | #72 | Exceptional 3.33 |
| Yaqui | 99.9 /100 | #73 | Exceptional 3.32 |
| Immigrants | Sierra Leone | 99.9 /100 | #74 | Exceptional 3.32 |
| Immigrants | Barbados | 99.8 /100 | #75 | Exceptional 3.32 |
| Trinidadians and Tobagonians | 99.8 /100 | #76 | Exceptional 3.32 |
| Immigrants | Ecuador | 99.8 /100 | #77 | Exceptional 3.32 |
| Immigrants | Micronesia | 99.8 /100 | #78 | Exceptional 3.32 |