Immigrants from Albania vs Immigrants from Cabo Verde Births to Unmarried Women
COMPARE
Immigrants from Albania
Immigrants from Cabo Verde
Births to Unmarried Women
Births to Unmarried Women Comparison
Immigrants from Albania
Immigrants from Cabo Verde
28.0%
BIRTHS TO UNMARRIED WOMEN
99.2/ 100
METRIC RATING
58th/ 347
METRIC RANK
42.2%
BIRTHS TO UNMARRIED WOMEN
0.0/ 100
METRIC RATING
328th/ 347
METRIC RANK
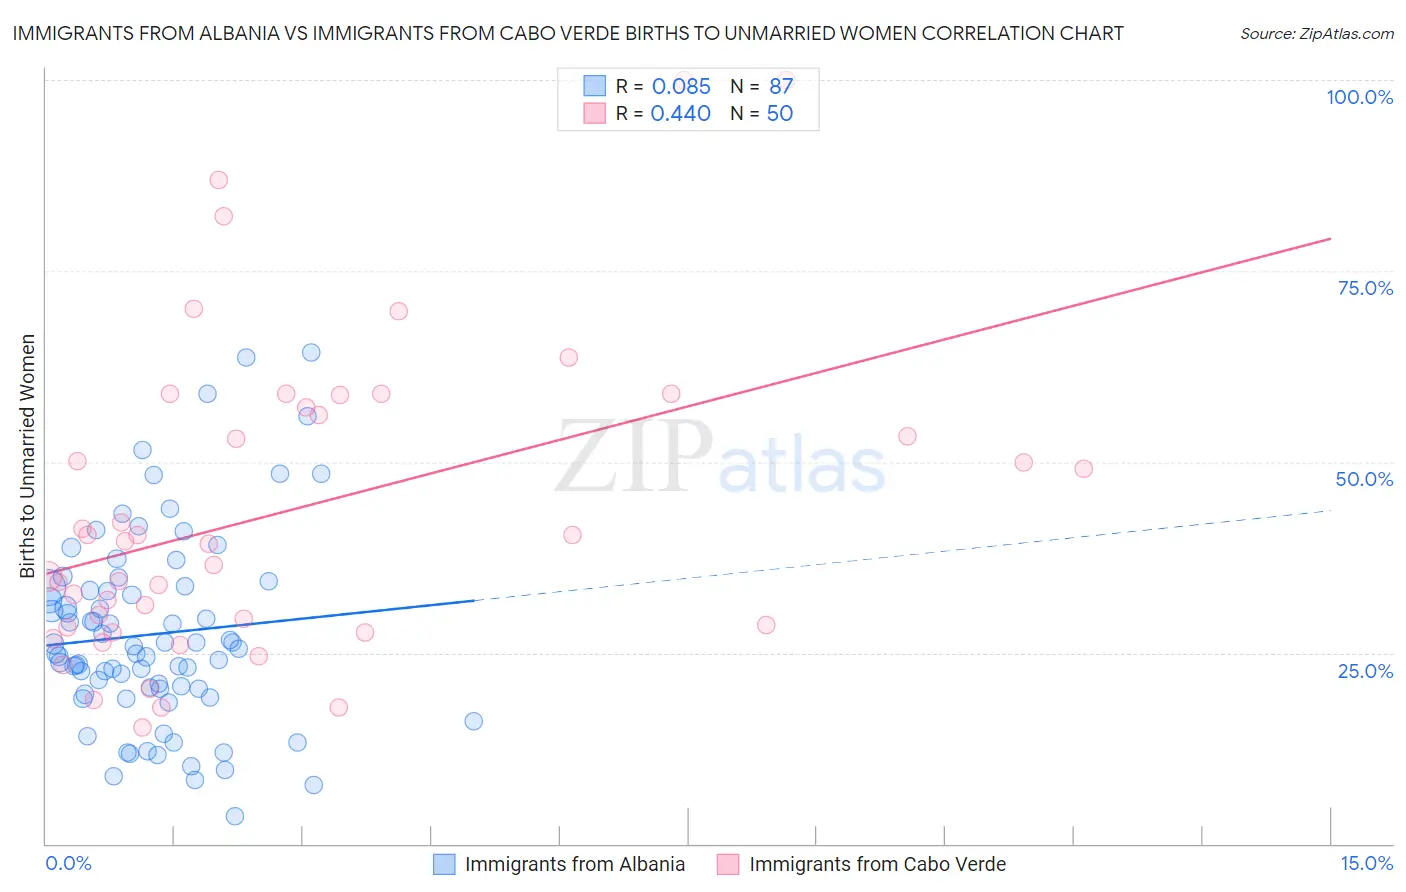
Immigrants from Albania vs Immigrants from Cabo Verde Births to Unmarried Women Correlation Chart
The statistical analysis conducted on geographies consisting of 114,601,314 people shows a slight positive correlation between the proportion of Immigrants from Albania and percentage of births to unmarried women in the United States with a correlation coefficient (R) of 0.085 and weighted average of 28.0%. Similarly, the statistical analysis conducted on geographies consisting of 37,364,845 people shows a moderate positive correlation between the proportion of Immigrants from Cabo Verde and percentage of births to unmarried women in the United States with a correlation coefficient (R) of 0.440 and weighted average of 42.2%, a difference of 50.5%.
Births to Unmarried Women Correlation Summary
| Measurement | Immigrants from Albania | Immigrants from Cabo Verde |
| Minimum | 3.6% | 15.3% |
| Maximum | 64.4% | 100.0% |
| Range | 60.8% | 84.7% |
| Mean | 27.4% | 43.6% |
| Median | 25.6% | 39.4% |
| Interquartile 25% (IQ1) | 20.3% | 28.3% |
| Interquartile 75% (IQ3) | 33.6% | 57.2% |
| Interquartile Range (IQR) | 13.3% | 28.9% |
| Standard Deviation (Sample) | 12.6% | 20.5% |
| Standard Deviation (Population) | 12.5% | 20.2% |
Similar Demographics by Births to Unmarried Women
Demographics Similar to Immigrants from Albania by Births to Unmarried Women
In terms of births to unmarried women, the demographic groups most similar to Immigrants from Albania are Russian (28.0%, a difference of 0.11%), Immigrants from Belgium (28.0%, a difference of 0.24%), Immigrants from Kazakhstan (28.1%, a difference of 0.25%), Immigrants from Turkey (28.1%, a difference of 0.29%), and Immigrants from North Macedonia (28.1%, a difference of 0.34%).
| Demographics | Rating | Rank | Births to Unmarried Women |
| Macedonians | 99.4 /100 | #51 | Exceptional 27.9% |
| Bhutanese | 99.4 /100 | #52 | Exceptional 27.9% |
| Immigrants | Romania | 99.4 /100 | #53 | Exceptional 27.9% |
| Afghans | 99.4 /100 | #54 | Exceptional 27.9% |
| Mongolians | 99.3 /100 | #55 | Exceptional 27.9% |
| Immigrants | Belgium | 99.3 /100 | #56 | Exceptional 28.0% |
| Russians | 99.2 /100 | #57 | Exceptional 28.0% |
| Immigrants | Albania | 99.2 /100 | #58 | Exceptional 28.0% |
| Immigrants | Kazakhstan | 99.1 /100 | #59 | Exceptional 28.1% |
| Immigrants | Turkey | 99.1 /100 | #60 | Exceptional 28.1% |
| Immigrants | North Macedonia | 99.1 /100 | #61 | Exceptional 28.1% |
| Egyptians | 99.0 /100 | #62 | Exceptional 28.2% |
| Immigrants | Serbia | 98.9 /100 | #63 | Exceptional 28.3% |
| Tongans | 98.8 /100 | #64 | Exceptional 28.4% |
| Immigrants | Czechoslovakia | 98.8 /100 | #65 | Exceptional 28.4% |
Demographics Similar to Immigrants from Cabo Verde by Births to Unmarried Women
In terms of births to unmarried women, the demographic groups most similar to Immigrants from Cabo Verde are Tsimshian (42.2%, a difference of 0.13%), Paiute (42.5%, a difference of 0.60%), Chippewa (42.6%, a difference of 1.0%), Immigrants from Cuba (41.5%, a difference of 1.8%), and Native/Alaskan (43.0%, a difference of 1.8%).
| Demographics | Rating | Rank | Births to Unmarried Women |
| Bahamians | 0.0 /100 | #321 | Tragic 40.8% |
| Cajuns | 0.0 /100 | #322 | Tragic 41.0% |
| Sioux | 0.0 /100 | #323 | Tragic 41.0% |
| Cape Verdeans | 0.0 /100 | #324 | Tragic 41.3% |
| Cheyenne | 0.0 /100 | #325 | Tragic 41.3% |
| Immigrants | Cuba | 0.0 /100 | #326 | Tragic 41.5% |
| Tsimshian | 0.0 /100 | #327 | Tragic 42.2% |
| Immigrants | Cabo Verde | 0.0 /100 | #328 | Tragic 42.2% |
| Paiute | 0.0 /100 | #329 | Tragic 42.5% |
| Chippewa | 0.0 /100 | #330 | Tragic 42.6% |
| Natives/Alaskans | 0.0 /100 | #331 | Tragic 43.0% |
| Kiowa | 0.0 /100 | #332 | Tragic 43.1% |
| Blacks/African Americans | 0.0 /100 | #333 | Tragic 44.3% |
| Yuman | 0.0 /100 | #334 | Tragic 44.4% |
| Colville | 0.0 /100 | #335 | Tragic 45.3% |