Immigrants from the Azores vs Immigrants from Cabo Verde Births to Unmarried Women
COMPARE
Immigrants from the Azores
Immigrants from Cabo Verde
Births to Unmarried Women
Births to Unmarried Women Comparison
Immigrants from the Azores
Immigrants from Cabo Verde
39.6%
BIRTHS TO UNMARRIED WOMEN
0.0/ 100
METRIC RATING
311th/ 347
METRIC RANK
42.2%
BIRTHS TO UNMARRIED WOMEN
0.0/ 100
METRIC RATING
328th/ 347
METRIC RANK
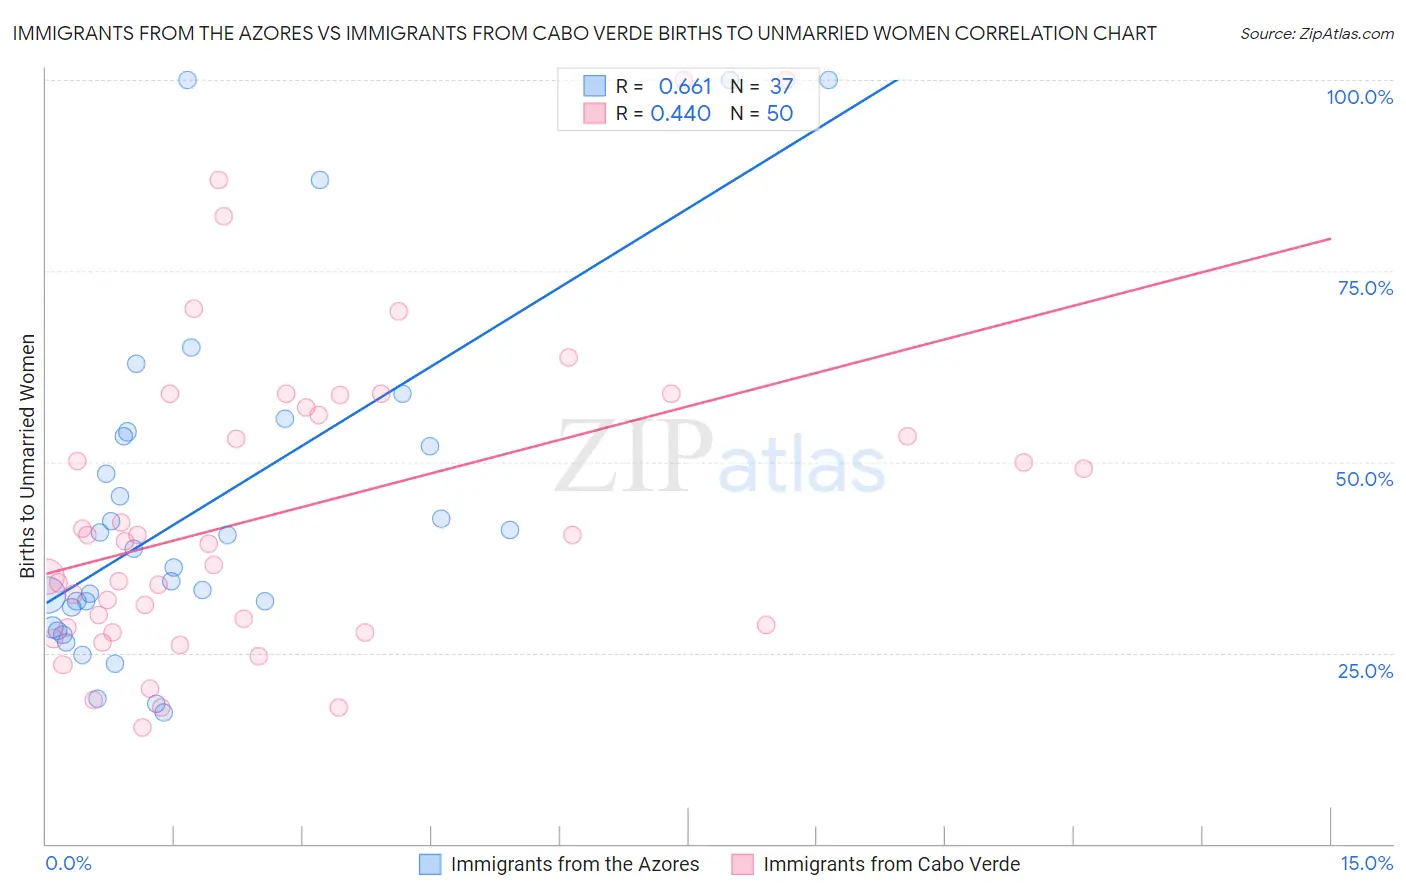
Immigrants from the Azores vs Immigrants from Cabo Verde Births to Unmarried Women Correlation Chart
The statistical analysis conducted on geographies consisting of 45,022,253 people shows a significant positive correlation between the proportion of Immigrants from the Azores and percentage of births to unmarried women in the United States with a correlation coefficient (R) of 0.661 and weighted average of 39.6%. Similarly, the statistical analysis conducted on geographies consisting of 37,364,845 people shows a moderate positive correlation between the proportion of Immigrants from Cabo Verde and percentage of births to unmarried women in the United States with a correlation coefficient (R) of 0.440 and weighted average of 42.2%, a difference of 6.7%.
Births to Unmarried Women Correlation Summary
| Measurement | Immigrants from the Azores | Immigrants from Cabo Verde |
| Minimum | 17.2% | 15.3% |
| Maximum | 100.0% | 100.0% |
| Range | 82.8% | 84.7% |
| Mean | 44.2% | 43.6% |
| Median | 38.6% | 39.4% |
| Interquartile 25% (IQ1) | 29.6% | 28.3% |
| Interquartile 75% (IQ3) | 53.6% | 57.2% |
| Interquartile Range (IQR) | 24.0% | 28.9% |
| Standard Deviation (Sample) | 22.2% | 20.5% |
| Standard Deviation (Population) | 21.9% | 20.2% |
Demographics Similar to Immigrants from the Azores and Immigrants from Cabo Verde by Births to Unmarried Women
In terms of births to unmarried women, the demographic groups most similar to Immigrants from the Azores are U.S. Virgin Islander (39.6%, a difference of 0.020%), Immigrants from Dominica (39.5%, a difference of 0.23%), African (39.7%, a difference of 0.36%), Cuban (39.4%, a difference of 0.46%), and Immigrants from Caribbean (39.8%, a difference of 0.65%). Similarly, the demographic groups most similar to Immigrants from Cabo Verde are Tsimshian (42.2%, a difference of 0.13%), Paiute (42.5%, a difference of 0.60%), Immigrants from Cuba (41.5%, a difference of 1.8%), Cheyenne (41.3%, a difference of 2.1%), and Cape Verdean (41.3%, a difference of 2.1%).
| Demographics | Rating | Rank | Births to Unmarried Women |
| Cubans | 0.0 /100 | #309 | Tragic 39.4% |
| Immigrants | Dominica | 0.0 /100 | #310 | Tragic 39.5% |
| Immigrants | Azores | 0.0 /100 | #311 | Tragic 39.6% |
| U.S. Virgin Islanders | 0.0 /100 | #312 | Tragic 39.6% |
| Africans | 0.0 /100 | #313 | Tragic 39.7% |
| Immigrants | Caribbean | 0.0 /100 | #314 | Tragic 39.8% |
| Dominicans | 0.0 /100 | #315 | Tragic 39.8% |
| Apache | 0.0 /100 | #316 | Tragic 39.9% |
| Immigrants | Dominican Republic | 0.0 /100 | #317 | Tragic 40.1% |
| Immigrants | Bahamas | 0.0 /100 | #318 | Tragic 40.1% |
| Yakama | 0.0 /100 | #319 | Tragic 40.3% |
| Crow | 0.0 /100 | #320 | Tragic 40.4% |
| Bahamians | 0.0 /100 | #321 | Tragic 40.8% |
| Cajuns | 0.0 /100 | #322 | Tragic 41.0% |
| Sioux | 0.0 /100 | #323 | Tragic 41.0% |
| Cape Verdeans | 0.0 /100 | #324 | Tragic 41.3% |
| Cheyenne | 0.0 /100 | #325 | Tragic 41.3% |
| Immigrants | Cuba | 0.0 /100 | #326 | Tragic 41.5% |
| Tsimshian | 0.0 /100 | #327 | Tragic 42.2% |
| Immigrants | Cabo Verde | 0.0 /100 | #328 | Tragic 42.2% |
| Paiute | 0.0 /100 | #329 | Tragic 42.5% |