Slovak vs Icelander Average Family Size
COMPARE
Slovak
Icelander
Average Family Size
Average Family Size Comparison
Slovaks
Icelanders
3.06
AVERAGE FAMILY SIZE
0.0/ 100
METRIC RATING
346th/ 347
METRIC RANK
3.19
AVERAGE FAMILY SIZE
5.2/ 100
METRIC RATING
230th/ 347
METRIC RANK
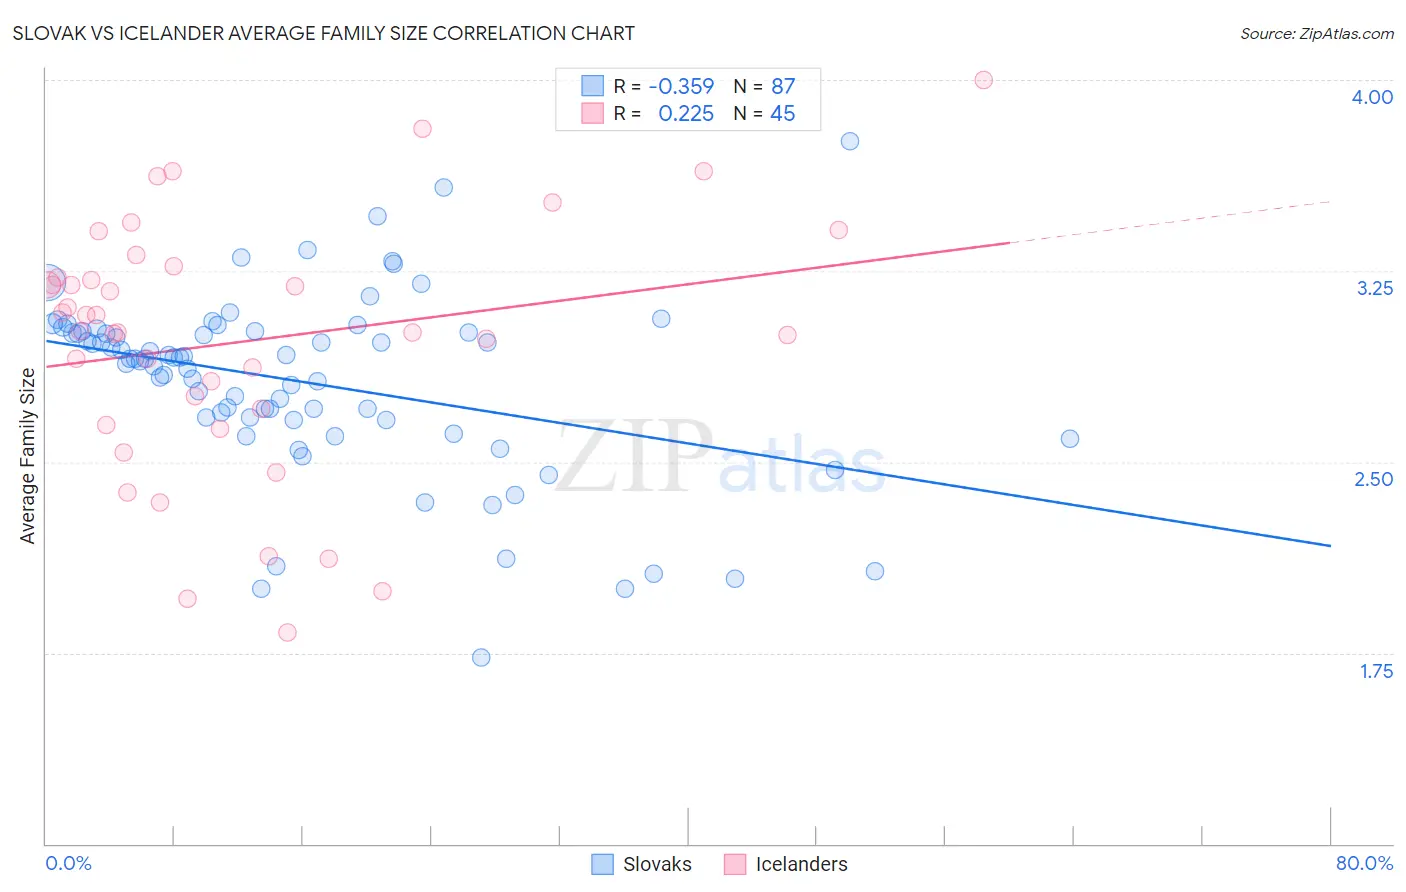
Slovak vs Icelander Average Family Size Correlation Chart
The statistical analysis conducted on geographies consisting of 397,683,086 people shows a mild negative correlation between the proportion of Slovaks and average family size in the United States with a correlation coefficient (R) of -0.359 and weighted average of 3.06. Similarly, the statistical analysis conducted on geographies consisting of 159,626,444 people shows a weak positive correlation between the proportion of Icelanders and average family size in the United States with a correlation coefficient (R) of 0.225 and weighted average of 3.19, a difference of 4.0%.
Average Family Size Correlation Summary
| Measurement | Slovak | Icelander |
| Minimum | 1.73 | 1.83 |
| Maximum | 3.76 | 4.00 |
| Range | 2.03 | 2.17 |
| Mean | 2.82 | 2.97 |
| Median | 2.91 | 3.02 |
| Interquartile 25% (IQ1) | 2.67 | 2.68 |
| Interquartile 75% (IQ3) | 3.01 | 3.25 |
| Interquartile Range (IQR) | 0.35 | 0.57 |
| Standard Deviation (Sample) | 0.36 | 0.50 |
| Standard Deviation (Population) | 0.36 | 0.49 |
Similar Demographics by Average Family Size
Demographics Similar to Slovaks by Average Family Size
In terms of average family size, the demographic groups most similar to Slovaks are Carpatho Rusyn (3.06, a difference of 0.060%), Slovene (3.07, a difference of 0.29%), French Canadian (3.07, a difference of 0.33%), Norwegian (3.08, a difference of 0.57%), and German (3.09, a difference of 0.80%).
| Demographics | Rating | Rank | Average Family Size |
| Estonians | 0.0 /100 | #333 | Tragic 3.10 |
| Lithuanians | 0.0 /100 | #334 | Tragic 3.10 |
| Luxembourgers | 0.0 /100 | #335 | Tragic 3.10 |
| Irish | 0.0 /100 | #336 | Tragic 3.10 |
| Swedes | 0.0 /100 | #337 | Tragic 3.10 |
| French | 0.0 /100 | #338 | Tragic 3.10 |
| Croatians | 0.0 /100 | #339 | Tragic 3.10 |
| Finns | 0.0 /100 | #340 | Tragic 3.09 |
| Poles | 0.0 /100 | #341 | Tragic 3.09 |
| Germans | 0.0 /100 | #342 | Tragic 3.09 |
| Norwegians | 0.0 /100 | #343 | Tragic 3.08 |
| French Canadians | 0.0 /100 | #344 | Tragic 3.07 |
| Slovenes | 0.0 /100 | #345 | Tragic 3.07 |
| Slovaks | 0.0 /100 | #346 | Tragic 3.06 |
| Carpatho Rusyns | 0.0 /100 | #347 | Tragic 3.06 |
Demographics Similar to Icelanders by Average Family Size
In terms of average family size, the demographic groups most similar to Icelanders are Basque (3.19, a difference of 0.0%), Immigrants from Italy (3.19, a difference of 0.010%), Cherokee (3.18, a difference of 0.040%), Nonimmigrants (3.19, a difference of 0.050%), and Portuguese (3.19, a difference of 0.070%).
| Demographics | Rating | Rank | Average Family Size |
| Immigrants | Zimbabwe | 7.1 /100 | #223 | Tragic 3.19 |
| Syrians | 6.5 /100 | #224 | Tragic 3.19 |
| Cree | 6.2 /100 | #225 | Tragic 3.19 |
| Chickasaw | 6.0 /100 | #226 | Tragic 3.19 |
| Portuguese | 6.0 /100 | #227 | Tragic 3.19 |
| Immigrants | Nonimmigrants | 5.7 /100 | #228 | Tragic 3.19 |
| Immigrants | Italy | 5.3 /100 | #229 | Tragic 3.19 |
| Icelanders | 5.2 /100 | #230 | Tragic 3.19 |
| Basques | 5.2 /100 | #231 | Tragic 3.19 |
| Cherokee | 4.7 /100 | #232 | Tragic 3.18 |
| Brazilians | 4.5 /100 | #233 | Tragic 3.18 |
| Iranians | 4.5 /100 | #234 | Tragic 3.18 |
| Immigrants | Turkey | 4.2 /100 | #235 | Tragic 3.18 |
| Immigrants | Portugal | 4.2 /100 | #236 | Tragic 3.18 |
| Immigrants | Romania | 3.7 /100 | #237 | Tragic 3.18 |