Hmong vs Hopi Single Father Households
COMPARE
Hmong
Hopi
Single Father Households
Single Father Households Comparison
Hmong
Hopi
2.4%
SINGLE FATHER HOUSEHOLDS
33.0/ 100
METRIC RATING
188th/ 347
METRIC RANK
2.8%
SINGLE FATHER HOUSEHOLDS
0.0/ 100
METRIC RATING
307th/ 347
METRIC RANK
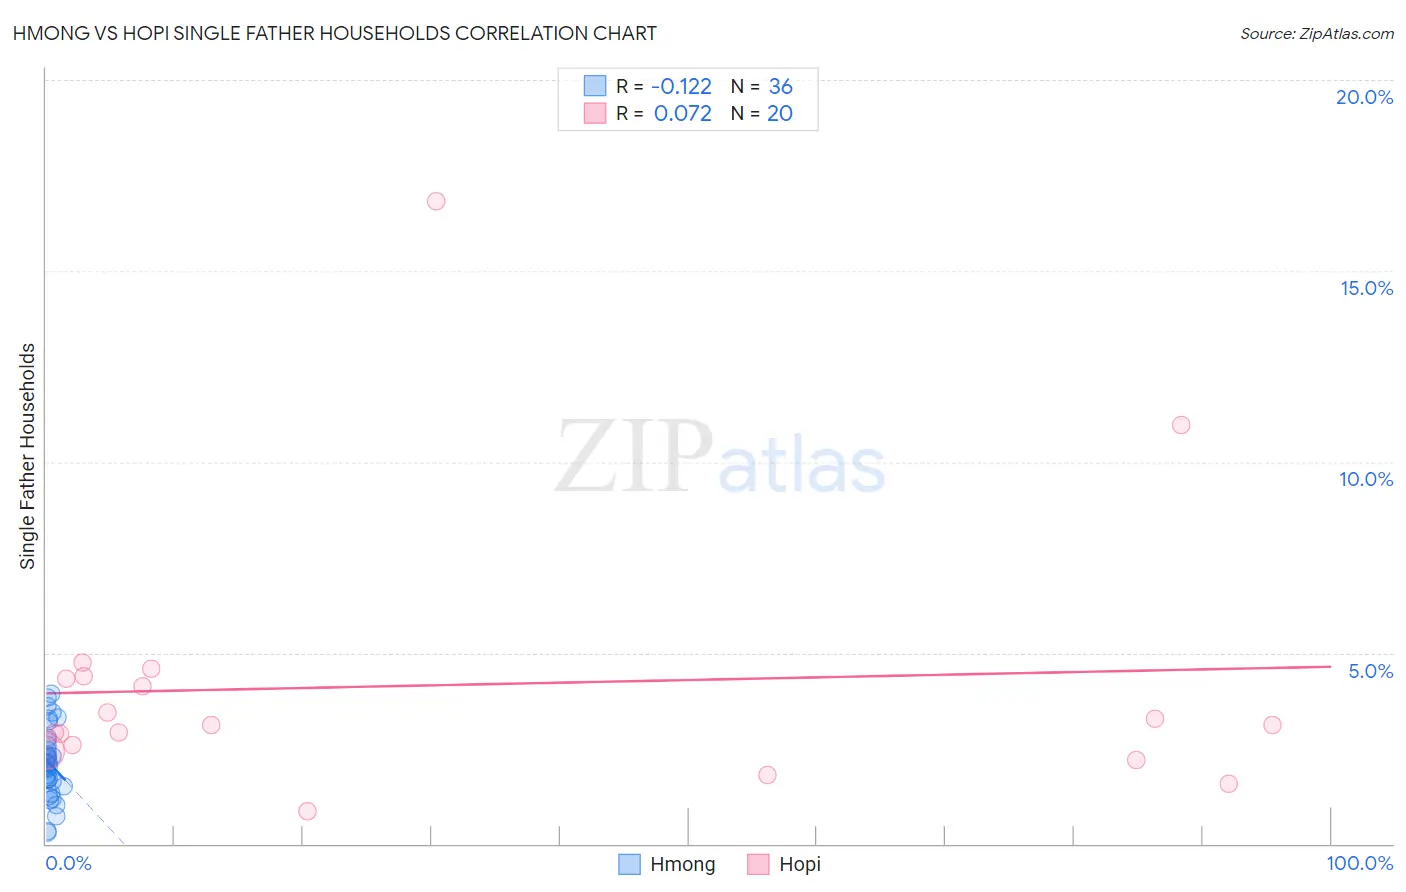
Hmong vs Hopi Single Father Households Correlation Chart
The statistical analysis conducted on geographies consisting of 24,655,242 people shows a poor negative correlation between the proportion of Hmong and percentage of single father households in the United States with a correlation coefficient (R) of -0.122 and weighted average of 2.4%. Similarly, the statistical analysis conducted on geographies consisting of 74,602,618 people shows a slight positive correlation between the proportion of Hopi and percentage of single father households in the United States with a correlation coefficient (R) of 0.072 and weighted average of 2.8%, a difference of 19.4%.
Single Father Households Correlation Summary
| Measurement | Hmong | Hopi |
| Minimum | 0.30% | 0.84% |
| Maximum | 3.9% | 16.8% |
| Range | 3.6% | 16.0% |
| Mean | 2.1% | 4.2% |
| Median | 2.1% | 3.1% |
| Interquartile 25% (IQ1) | 1.6% | 2.5% |
| Interquartile 75% (IQ3) | 2.7% | 4.4% |
| Interquartile Range (IQR) | 1.1% | 1.9% |
| Standard Deviation (Sample) | 0.92% | 3.6% |
| Standard Deviation (Population) | 0.91% | 3.5% |
Similar Demographics by Single Father Households
Demographics Similar to Hmong by Single Father Households
In terms of single father households, the demographic groups most similar to Hmong are Immigrants from Colombia (2.4%, a difference of 0.080%), U.S. Virgin Islander (2.4%, a difference of 0.10%), French (2.4%, a difference of 0.11%), Immigrants from Africa (2.4%, a difference of 0.25%), and Immigrants from Sudan (2.4%, a difference of 0.27%).
| Demographics | Rating | Rank | Single Father Households |
| Jamaicans | 43.5 /100 | #181 | Average 2.3% |
| Belgians | 43.3 /100 | #182 | Average 2.3% |
| Immigrants | Panama | 41.8 /100 | #183 | Average 2.4% |
| Sri Lankans | 41.8 /100 | #184 | Average 2.4% |
| Nigerians | 41.0 /100 | #185 | Average 2.4% |
| Immigrants | Bosnia and Herzegovina | 40.4 /100 | #186 | Average 2.4% |
| Immigrants | Colombia | 34.0 /100 | #187 | Fair 2.4% |
| Hmong | 33.0 /100 | #188 | Fair 2.4% |
| U.S. Virgin Islanders | 31.8 /100 | #189 | Fair 2.4% |
| French | 31.7 /100 | #190 | Fair 2.4% |
| Immigrants | Africa | 30.0 /100 | #191 | Fair 2.4% |
| Immigrants | Sudan | 29.8 /100 | #192 | Fair 2.4% |
| Uruguayans | 29.7 /100 | #193 | Fair 2.4% |
| Panamanians | 29.6 /100 | #194 | Fair 2.4% |
| Immigrants | Philippines | 28.7 /100 | #195 | Fair 2.4% |
Demographics Similar to Hopi by Single Father Households
In terms of single father households, the demographic groups most similar to Hopi are Immigrants from the Azores (2.8%, a difference of 0.17%), Apache (2.8%, a difference of 0.18%), Hispanic or Latino (2.8%, a difference of 0.32%), Mexican American Indian (2.8%, a difference of 0.48%), and Immigrants from Honduras (2.8%, a difference of 0.79%).
| Demographics | Rating | Rank | Single Father Households |
| Kiowa | 0.0 /100 | #300 | Tragic 2.8% |
| Immigrants | Latin America | 0.0 /100 | #301 | Tragic 2.8% |
| Spanish Americans | 0.0 /100 | #302 | Tragic 2.8% |
| Immigrants | Honduras | 0.0 /100 | #303 | Tragic 2.8% |
| Mexican American Indians | 0.0 /100 | #304 | Tragic 2.8% |
| Hispanics or Latinos | 0.0 /100 | #305 | Tragic 2.8% |
| Immigrants | Azores | 0.0 /100 | #306 | Tragic 2.8% |
| Hopi | 0.0 /100 | #307 | Tragic 2.8% |
| Apache | 0.0 /100 | #308 | Tragic 2.8% |
| Central Americans | 0.0 /100 | #309 | Tragic 2.9% |
| Immigrants | Laos | 0.0 /100 | #310 | Tragic 2.9% |
| Spanish American Indians | 0.0 /100 | #311 | Tragic 2.9% |
| Tsimshian | 0.0 /100 | #312 | Tragic 2.9% |
| Arapaho | 0.0 /100 | #313 | Tragic 2.9% |
| Salvadorans | 0.0 /100 | #314 | Tragic 2.9% |