Immigrants from Serbia vs Hopi Single Father Households
COMPARE
Immigrants from Serbia
Hopi
Single Father Households
Single Father Households Comparison
Immigrants from Serbia
Hopi
2.0%
SINGLE FATHER HOUSEHOLDS
99.9/ 100
METRIC RATING
49th/ 347
METRIC RANK
2.8%
SINGLE FATHER HOUSEHOLDS
0.0/ 100
METRIC RATING
307th/ 347
METRIC RANK
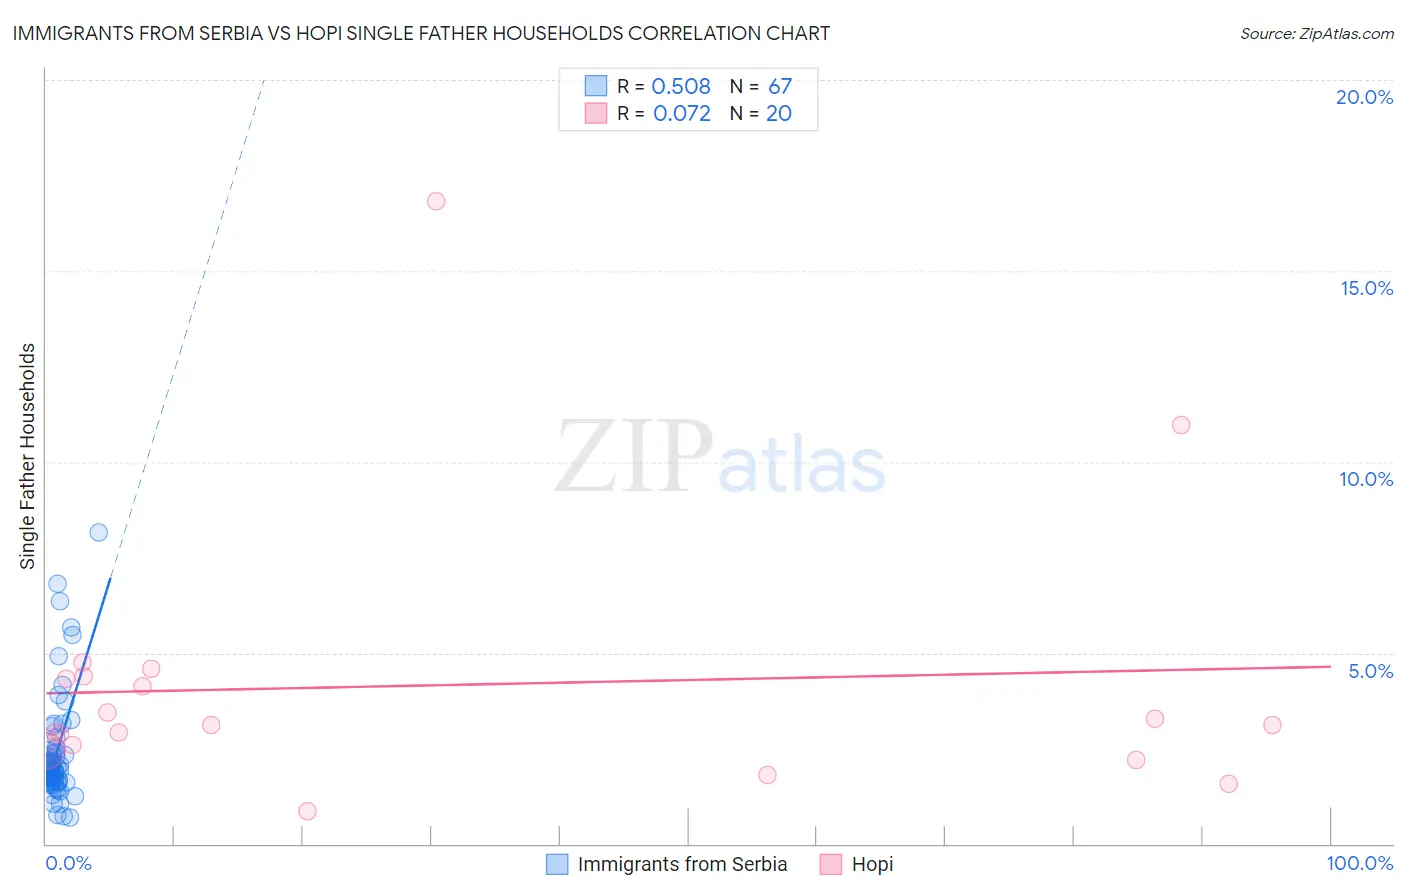
Immigrants from Serbia vs Hopi Single Father Households Correlation Chart
The statistical analysis conducted on geographies consisting of 131,321,851 people shows a substantial positive correlation between the proportion of Immigrants from Serbia and percentage of single father households in the United States with a correlation coefficient (R) of 0.508 and weighted average of 2.0%. Similarly, the statistical analysis conducted on geographies consisting of 74,602,618 people shows a slight positive correlation between the proportion of Hopi and percentage of single father households in the United States with a correlation coefficient (R) of 0.072 and weighted average of 2.8%, a difference of 40.3%.
Single Father Households Correlation Summary
| Measurement | Immigrants from Serbia | Hopi |
| Minimum | 0.69% | 0.84% |
| Maximum | 8.1% | 16.8% |
| Range | 7.5% | 16.0% |
| Mean | 2.4% | 4.2% |
| Median | 2.0% | 3.1% |
| Interquartile 25% (IQ1) | 1.6% | 2.5% |
| Interquartile 75% (IQ3) | 2.4% | 4.4% |
| Interquartile Range (IQR) | 0.74% | 1.9% |
| Standard Deviation (Sample) | 1.4% | 3.6% |
| Standard Deviation (Population) | 1.4% | 3.5% |
Similar Demographics by Single Father Households
Demographics Similar to Immigrants from Serbia by Single Father Households
In terms of single father households, the demographic groups most similar to Immigrants from Serbia are Immigrants from Switzerland (2.0%, a difference of 0.0%), Immigrants from Poland (2.0%, a difference of 0.0%), Immigrants from Kazakhstan (2.0%, a difference of 0.010%), Immigrants from Ukraine (2.0%, a difference of 0.030%), and Immigrants from Europe (2.0%, a difference of 0.25%).
| Demographics | Rating | Rank | Single Father Households |
| Macedonians | 100.0 /100 | #42 | Exceptional 2.0% |
| Immigrants | Grenada | 100.0 /100 | #43 | Exceptional 2.0% |
| Latvians | 100.0 /100 | #44 | Exceptional 2.0% |
| Russians | 100.0 /100 | #45 | Exceptional 2.0% |
| Immigrants | Lebanon | 100.0 /100 | #46 | Exceptional 2.0% |
| Immigrants | Ukraine | 99.9 /100 | #47 | Exceptional 2.0% |
| Immigrants | Kazakhstan | 99.9 /100 | #48 | Exceptional 2.0% |
| Immigrants | Serbia | 99.9 /100 | #49 | Exceptional 2.0% |
| Immigrants | Switzerland | 99.9 /100 | #50 | Exceptional 2.0% |
| Immigrants | Poland | 99.9 /100 | #51 | Exceptional 2.0% |
| Immigrants | Europe | 99.9 /100 | #52 | Exceptional 2.0% |
| Immigrants | Northern Europe | 99.9 /100 | #53 | Exceptional 2.0% |
| Immigrants | Korea | 99.9 /100 | #54 | Exceptional 2.0% |
| Immigrants | France | 99.9 /100 | #55 | Exceptional 2.0% |
| Immigrants | Norway | 99.9 /100 | #56 | Exceptional 2.0% |
Demographics Similar to Hopi by Single Father Households
In terms of single father households, the demographic groups most similar to Hopi are Immigrants from the Azores (2.8%, a difference of 0.17%), Apache (2.8%, a difference of 0.18%), Hispanic or Latino (2.8%, a difference of 0.32%), Mexican American Indian (2.8%, a difference of 0.48%), and Immigrants from Honduras (2.8%, a difference of 0.79%).
| Demographics | Rating | Rank | Single Father Households |
| Kiowa | 0.0 /100 | #300 | Tragic 2.8% |
| Immigrants | Latin America | 0.0 /100 | #301 | Tragic 2.8% |
| Spanish Americans | 0.0 /100 | #302 | Tragic 2.8% |
| Immigrants | Honduras | 0.0 /100 | #303 | Tragic 2.8% |
| Mexican American Indians | 0.0 /100 | #304 | Tragic 2.8% |
| Hispanics or Latinos | 0.0 /100 | #305 | Tragic 2.8% |
| Immigrants | Azores | 0.0 /100 | #306 | Tragic 2.8% |
| Hopi | 0.0 /100 | #307 | Tragic 2.8% |
| Apache | 0.0 /100 | #308 | Tragic 2.8% |
| Central Americans | 0.0 /100 | #309 | Tragic 2.9% |
| Immigrants | Laos | 0.0 /100 | #310 | Tragic 2.9% |
| Spanish American Indians | 0.0 /100 | #311 | Tragic 2.9% |
| Tsimshian | 0.0 /100 | #312 | Tragic 2.9% |
| Arapaho | 0.0 /100 | #313 | Tragic 2.9% |
| Salvadorans | 0.0 /100 | #314 | Tragic 2.9% |