Greek vs Malaysian Family Households
COMPARE
Greek
Malaysian
Family Households
Family Households Comparison
Greeks
Malaysians
64.7%
FAMILY HOUSEHOLDS
88.1/ 100
METRIC RATING
134th/ 347
METRIC RANK
65.9%
FAMILY HOUSEHOLDS
99.9/ 100
METRIC RATING
69th/ 347
METRIC RANK
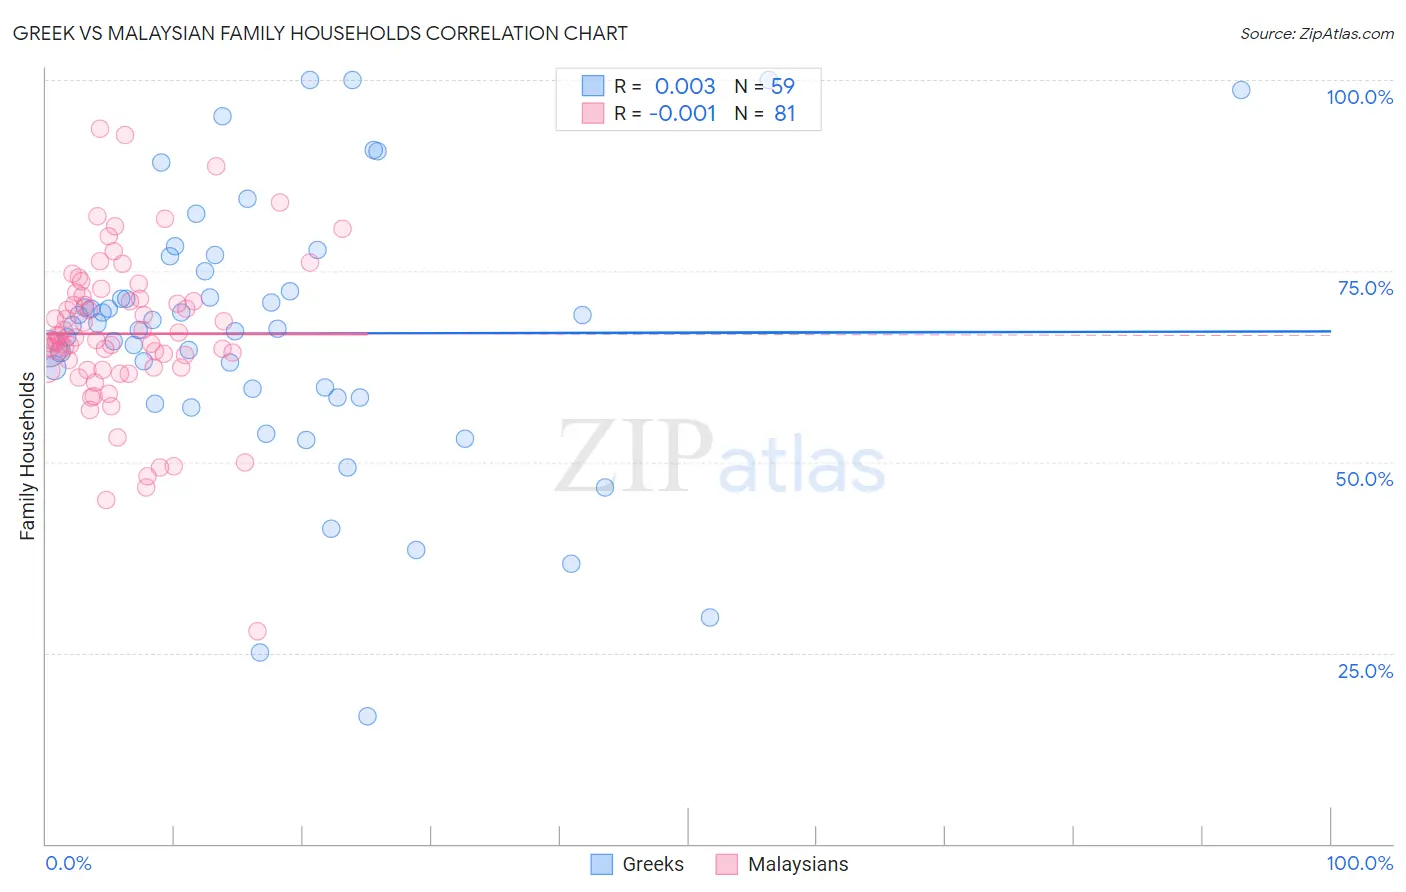
Greek vs Malaysian Family Households Correlation Chart
The statistical analysis conducted on geographies consisting of 482,359,857 people shows no correlation between the proportion of Greeks and percentage of family households in the United States with a correlation coefficient (R) of 0.003 and weighted average of 64.7%. Similarly, the statistical analysis conducted on geographies consisting of 226,012,303 people shows no correlation between the proportion of Malaysians and percentage of family households in the United States with a correlation coefficient (R) of -0.001 and weighted average of 65.9%, a difference of 1.8%.
Family Households Correlation Summary
| Measurement | Greek | Malaysian |
| Minimum | 16.7% | 27.8% |
| Maximum | 100.0% | 93.6% |
| Range | 83.3% | 65.8% |
| Mean | 66.8% | 66.8% |
| Median | 67.9% | 65.9% |
| Interquartile 25% (IQ1) | 58.5% | 62.2% |
| Interquartile 75% (IQ3) | 74.9% | 71.5% |
| Interquartile Range (IQR) | 16.5% | 9.3% |
| Standard Deviation (Sample) | 17.5% | 10.3% |
| Standard Deviation (Population) | 17.4% | 10.3% |
Similar Demographics by Family Households
Demographics Similar to Greeks by Family Households
In terms of family households, the demographic groups most similar to Greeks are Maltese (64.7%, a difference of 0.020%), Cajun (64.8%, a difference of 0.040%), Belizean (64.8%, a difference of 0.040%), Immigrants from China (64.7%, a difference of 0.050%), and Immigrants from Scotland (64.7%, a difference of 0.050%).
| Demographics | Rating | Rank | Family Households |
| Immigrants | Panama | 92.0 /100 | #127 | Exceptional 64.8% |
| Italians | 91.9 /100 | #128 | Exceptional 64.8% |
| Immigrants | Ecuador | 91.4 /100 | #129 | Exceptional 64.8% |
| Immigrants | Italy | 90.2 /100 | #130 | Exceptional 64.8% |
| Immigrants | Nonimmigrants | 90.1 /100 | #131 | Exceptional 64.8% |
| Cajuns | 89.4 /100 | #132 | Excellent 64.8% |
| Belizeans | 89.3 /100 | #133 | Excellent 64.8% |
| Greeks | 88.1 /100 | #134 | Excellent 64.7% |
| Maltese | 87.4 /100 | #135 | Excellent 64.7% |
| Immigrants | China | 86.6 /100 | #136 | Excellent 64.7% |
| Immigrants | Scotland | 86.4 /100 | #137 | Excellent 64.7% |
| Basques | 85.5 /100 | #138 | Excellent 64.7% |
| Immigrants | Jamaica | 85.3 /100 | #139 | Excellent 64.7% |
| Immigrants | North Macedonia | 84.9 /100 | #140 | Excellent 64.7% |
| Immigrants | Cameroon | 84.8 /100 | #141 | Excellent 64.7% |
Demographics Similar to Malaysians by Family Households
In terms of family households, the demographic groups most similar to Malaysians are Immigrants from Afghanistan (65.9%, a difference of 0.010%), Bhutanese (65.9%, a difference of 0.020%), Japanese (65.9%, a difference of 0.030%), Fijian (65.9%, a difference of 0.050%), and Filipino (65.9%, a difference of 0.050%).
| Demographics | Rating | Rank | Family Households |
| Central Americans | 100.0 /100 | #62 | Exceptional 66.0% |
| Immigrants | Indonesia | 100.0 /100 | #63 | Exceptional 66.0% |
| Pima | 99.9 /100 | #64 | Exceptional 65.9% |
| Costa Ricans | 99.9 /100 | #65 | Exceptional 65.9% |
| Fijians | 99.9 /100 | #66 | Exceptional 65.9% |
| Filipinos | 99.9 /100 | #67 | Exceptional 65.9% |
| Japanese | 99.9 /100 | #68 | Exceptional 65.9% |
| Malaysians | 99.9 /100 | #69 | Exceptional 65.9% |
| Immigrants | Afghanistan | 99.9 /100 | #70 | Exceptional 65.9% |
| Bhutanese | 99.9 /100 | #71 | Exceptional 65.9% |
| Portuguese | 99.9 /100 | #72 | Exceptional 65.8% |
| Laotians | 99.9 /100 | #73 | Exceptional 65.8% |
| Burmese | 99.9 /100 | #74 | Exceptional 65.7% |
| Houma | 99.9 /100 | #75 | Exceptional 65.7% |
| Immigrants | Azores | 99.8 /100 | #76 | Exceptional 65.6% |