French Canadian vs West Indian Family Households
COMPARE
French Canadian
West Indian
Family Households
Family Households Comparison
French Canadians
West Indians
63.7%
FAMILY HOUSEHOLDS
5.4/ 100
METRIC RATING
223rd/ 347
METRIC RANK
63.1%
FAMILY HOUSEHOLDS
0.3/ 100
METRIC RATING
275th/ 347
METRIC RANK
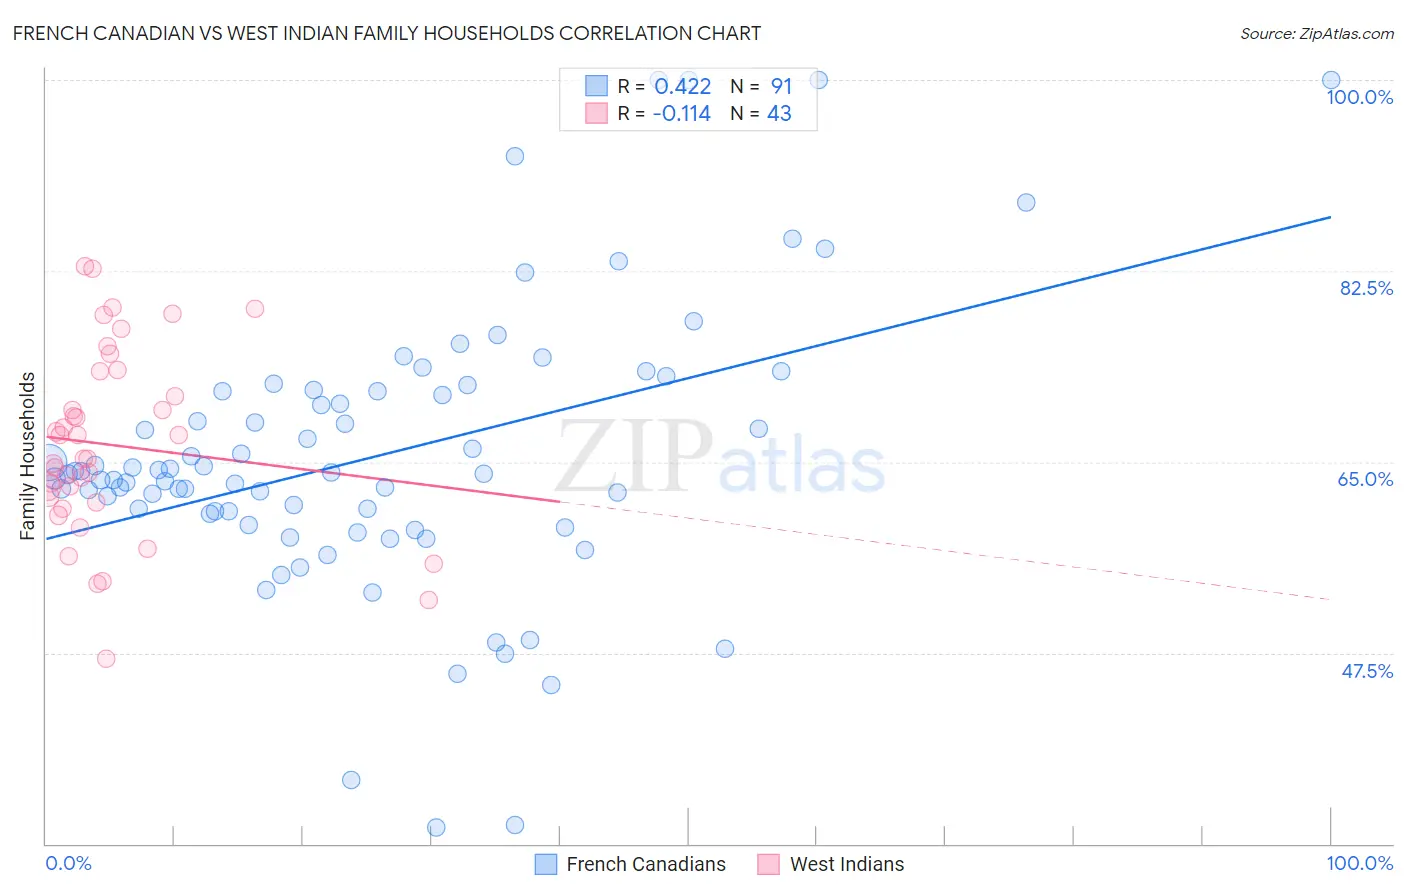
French Canadian vs West Indian Family Households Correlation Chart
The statistical analysis conducted on geographies consisting of 502,269,037 people shows a moderate positive correlation between the proportion of French Canadians and percentage of family households in the United States with a correlation coefficient (R) of 0.422 and weighted average of 63.7%. Similarly, the statistical analysis conducted on geographies consisting of 253,859,677 people shows a poor negative correlation between the proportion of West Indians and percentage of family households in the United States with a correlation coefficient (R) of -0.114 and weighted average of 63.1%, a difference of 0.99%.
Family Households Correlation Summary
| Measurement | French Canadian | West Indian |
| Minimum | 31.5% | 47.0% |
| Maximum | 100.0% | 83.0% |
| Range | 68.5% | 36.0% |
| Mean | 65.5% | 66.5% |
| Median | 63.9% | 65.3% |
| Interquartile 25% (IQ1) | 60.3% | 61.3% |
| Interquartile 75% (IQ3) | 71.5% | 73.3% |
| Interquartile Range (IQR) | 11.2% | 12.0% |
| Standard Deviation (Sample) | 12.9% | 8.5% |
| Standard Deviation (Population) | 12.9% | 8.4% |
Similar Demographics by Family Households
Demographics Similar to French Canadians by Family Households
In terms of family households, the demographic groups most similar to French Canadians are Immigrants from Belarus (63.7%, a difference of 0.010%), Immigrants from South Africa (63.7%, a difference of 0.040%), Immigrants from Europe (63.7%, a difference of 0.060%), Macedonian (63.7%, a difference of 0.070%), and Turkish (63.6%, a difference of 0.070%).
| Demographics | Rating | Rank | Family Households |
| Croatians | 7.3 /100 | #216 | Tragic 63.8% |
| Osage | 7.0 /100 | #217 | Tragic 63.7% |
| Marshallese | 6.9 /100 | #218 | Tragic 63.7% |
| Macedonians | 6.5 /100 | #219 | Tragic 63.7% |
| Immigrants | Europe | 6.4 /100 | #220 | Tragic 63.7% |
| Immigrants | South Africa | 5.9 /100 | #221 | Tragic 63.7% |
| Immigrants | Belarus | 5.5 /100 | #222 | Tragic 63.7% |
| French Canadians | 5.4 /100 | #223 | Tragic 63.7% |
| Turks | 4.5 /100 | #224 | Tragic 63.6% |
| Immigrants | Hungary | 4.3 /100 | #225 | Tragic 63.6% |
| Immigrants | Bahamas | 4.2 /100 | #226 | Tragic 63.6% |
| Trinidadians and Tobagonians | 4.1 /100 | #227 | Tragic 63.6% |
| Blackfeet | 3.6 /100 | #228 | Tragic 63.6% |
| Bulgarians | 3.4 /100 | #229 | Tragic 63.6% |
| Immigrants | Brazil | 3.0 /100 | #230 | Tragic 63.6% |
Demographics Similar to West Indians by Family Households
In terms of family households, the demographic groups most similar to West Indians are Lumbee (63.1%, a difference of 0.0%), Immigrants from Kazakhstan (63.1%, a difference of 0.010%), Serbian (63.0%, a difference of 0.010%), Immigrants from Croatia (63.1%, a difference of 0.020%), and Immigrants from Turkey (63.1%, a difference of 0.020%).
| Demographics | Rating | Rank | Family Households |
| Immigrants | Singapore | 0.4 /100 | #268 | Tragic 63.1% |
| Yugoslavians | 0.4 /100 | #269 | Tragic 63.1% |
| Immigrants | Austria | 0.3 /100 | #270 | Tragic 63.1% |
| Immigrants | Croatia | 0.3 /100 | #271 | Tragic 63.1% |
| Immigrants | Turkey | 0.3 /100 | #272 | Tragic 63.1% |
| Immigrants | Kazakhstan | 0.3 /100 | #273 | Tragic 63.1% |
| Lumbee | 0.3 /100 | #274 | Tragic 63.1% |
| West Indians | 0.3 /100 | #275 | Tragic 63.1% |
| Serbians | 0.3 /100 | #276 | Tragic 63.0% |
| Ottawa | 0.3 /100 | #277 | Tragic 63.0% |
| Immigrants | Belgium | 0.2 /100 | #278 | Tragic 63.0% |
| Immigrants | Yemen | 0.2 /100 | #279 | Tragic 63.0% |
| Immigrants | Bulgaria | 0.2 /100 | #280 | Tragic 63.0% |
| Estonians | 0.2 /100 | #281 | Tragic 62.9% |
| New Zealanders | 0.1 /100 | #282 | Tragic 62.9% |