Finnish vs Belizean Single Mother Households
COMPARE
Finnish
Belizean
Single Mother Households
Single Mother Households Comparison
Finns
Belizeans
5.7%
SINGLE MOTHER HOUSEHOLDS
97.6/ 100
METRIC RATING
86th/ 347
METRIC RANK
7.6%
SINGLE MOTHER HOUSEHOLDS
0.1/ 100
METRIC RATING
273rd/ 347
METRIC RANK
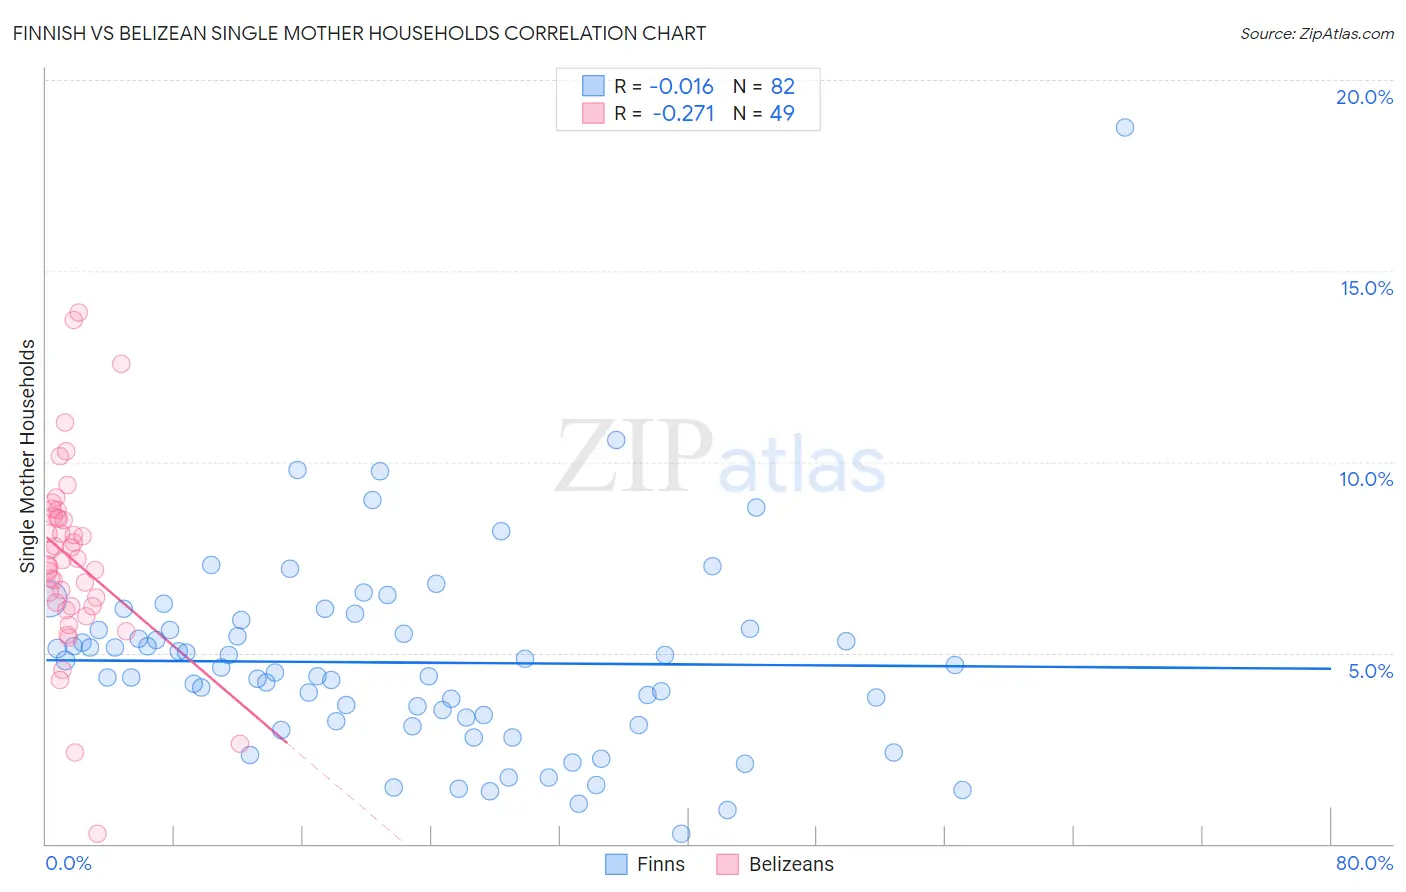
Finnish vs Belizean Single Mother Households Correlation Chart
The statistical analysis conducted on geographies consisting of 403,107,301 people shows no correlation between the proportion of Finns and percentage of single mother households in the United States with a correlation coefficient (R) of -0.016 and weighted average of 5.7%. Similarly, the statistical analysis conducted on geographies consisting of 144,083,349 people shows a weak negative correlation between the proportion of Belizeans and percentage of single mother households in the United States with a correlation coefficient (R) of -0.271 and weighted average of 7.6%, a difference of 33.2%.
Single Mother Households Correlation Summary
| Measurement | Finnish | Belizean |
| Minimum | 0.26% | 0.26% |
| Maximum | 18.8% | 13.9% |
| Range | 18.5% | 13.7% |
| Mean | 4.7% | 7.5% |
| Median | 4.5% | 7.4% |
| Interquartile 25% (IQ1) | 3.2% | 6.2% |
| Interquartile 75% (IQ3) | 5.6% | 8.5% |
| Interquartile Range (IQR) | 2.4% | 2.3% |
| Standard Deviation (Sample) | 2.6% | 2.5% |
| Standard Deviation (Population) | 2.6% | 2.5% |
Similar Demographics by Single Mother Households
Demographics Similar to Finns by Single Mother Households
In terms of single mother households, the demographic groups most similar to Finns are Hungarian (5.7%, a difference of 0.030%), Immigrants from Turkey (5.7%, a difference of 0.080%), Israeli (5.7%, a difference of 0.15%), Carpatho Rusyn (5.7%, a difference of 0.18%), and Immigrants from Hungary (5.7%, a difference of 0.25%).
| Demographics | Rating | Rank | Single Mother Households |
| Immigrants | Sri Lanka | 98.0 /100 | #79 | Exceptional 5.6% |
| Czechs | 97.9 /100 | #80 | Exceptional 5.6% |
| Immigrants | Moldova | 97.9 /100 | #81 | Exceptional 5.6% |
| Immigrants | Malaysia | 97.8 /100 | #82 | Exceptional 5.7% |
| Immigrants | Hungary | 97.8 /100 | #83 | Exceptional 5.7% |
| Carpatho Rusyns | 97.7 /100 | #84 | Exceptional 5.7% |
| Hungarians | 97.6 /100 | #85 | Exceptional 5.7% |
| Finns | 97.6 /100 | #86 | Exceptional 5.7% |
| Immigrants | Turkey | 97.5 /100 | #87 | Exceptional 5.7% |
| Israelis | 97.4 /100 | #88 | Exceptional 5.7% |
| Ukrainians | 97.2 /100 | #89 | Exceptional 5.7% |
| Immigrants | Indonesia | 97.2 /100 | #90 | Exceptional 5.7% |
| Europeans | 97.0 /100 | #91 | Exceptional 5.7% |
| Immigrants | Western Asia | 96.7 /100 | #92 | Exceptional 5.7% |
| Serbians | 96.7 /100 | #93 | Exceptional 5.7% |
Demographics Similar to Belizeans by Single Mother Households
In terms of single mother households, the demographic groups most similar to Belizeans are Immigrants from Guyana (7.6%, a difference of 0.040%), Central American Indian (7.6%, a difference of 0.14%), Immigrants from the Azores (7.5%, a difference of 0.31%), Salvadoran (7.5%, a difference of 0.32%), and Immigrants from Cuba (7.5%, a difference of 0.40%).
| Demographics | Rating | Rank | Single Mother Households |
| Nepalese | 0.1 /100 | #266 | Tragic 7.5% |
| Blackfeet | 0.1 /100 | #267 | Tragic 7.5% |
| Indonesians | 0.1 /100 | #268 | Tragic 7.5% |
| Somalis | 0.1 /100 | #269 | Tragic 7.5% |
| Immigrants | Cuba | 0.1 /100 | #270 | Tragic 7.5% |
| Salvadorans | 0.1 /100 | #271 | Tragic 7.5% |
| Immigrants | Azores | 0.1 /100 | #272 | Tragic 7.5% |
| Belizeans | 0.1 /100 | #273 | Tragic 7.6% |
| Immigrants | Guyana | 0.1 /100 | #274 | Tragic 7.6% |
| Central American Indians | 0.1 /100 | #275 | Tragic 7.6% |
| Guyanese | 0.1 /100 | #276 | Tragic 7.6% |
| Immigrants | Trinidad and Tobago | 0.1 /100 | #277 | Tragic 7.6% |
| Central Americans | 0.1 /100 | #278 | Tragic 7.6% |
| Immigrants | El Salvador | 0.0 /100 | #279 | Tragic 7.6% |
| Immigrants | Sierra Leone | 0.0 /100 | #280 | Tragic 7.7% |