Immigrants from Belize vs Belizean Single Mother Households
COMPARE
Immigrants from Belize
Belizean
Single Mother Households
Single Mother Households Comparison
Immigrants from Belize
Belizeans
7.7%
SINGLE MOTHER HOUSEHOLDS
0.0/ 100
METRIC RATING
284th/ 347
METRIC RANK
7.6%
SINGLE MOTHER HOUSEHOLDS
0.1/ 100
METRIC RATING
273rd/ 347
METRIC RANK
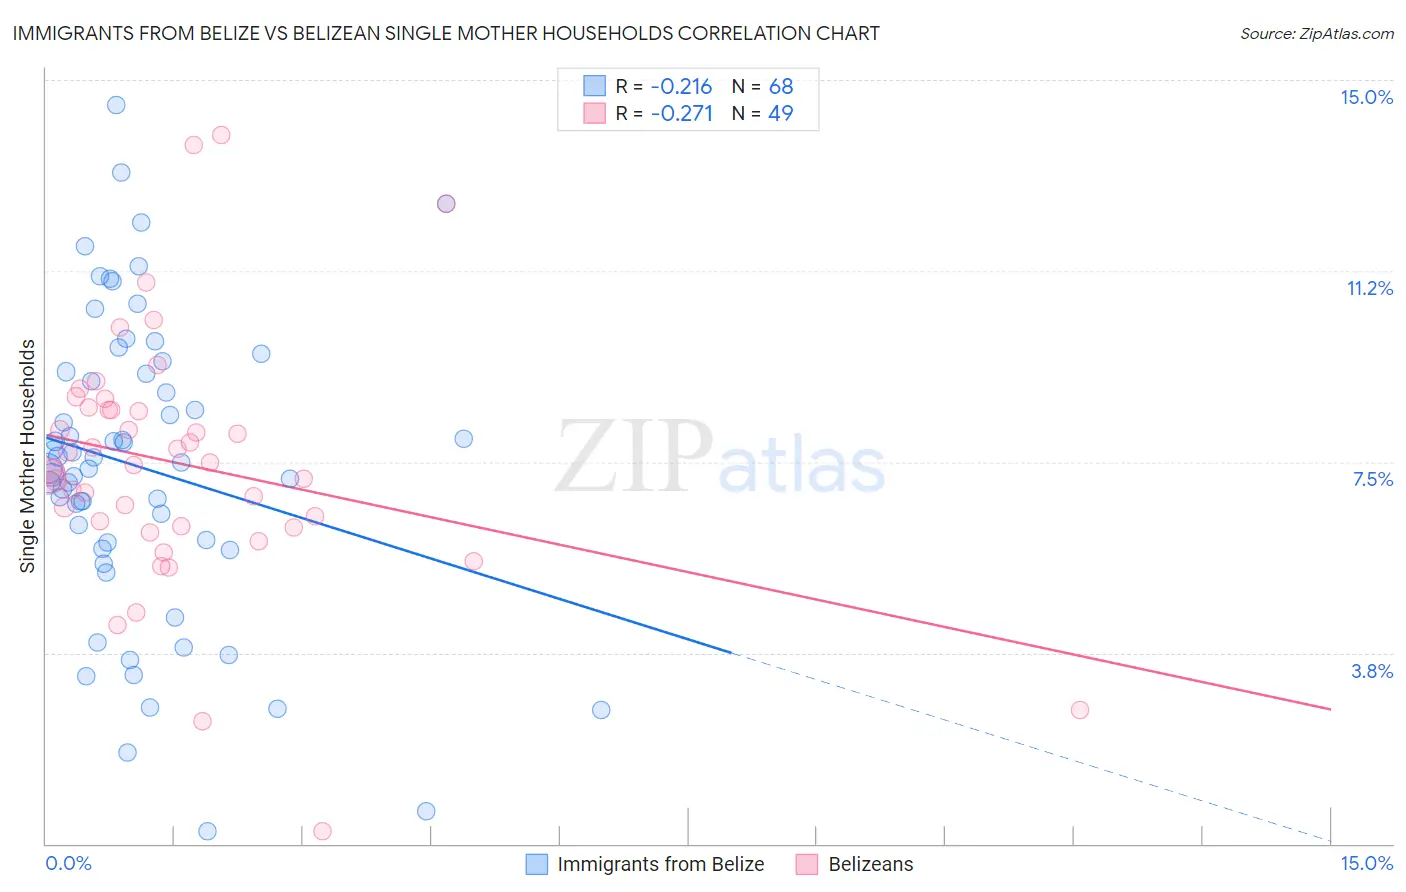
Immigrants from Belize vs Belizean Single Mother Households Correlation Chart
The statistical analysis conducted on geographies consisting of 130,177,465 people shows a weak negative correlation between the proportion of Immigrants from Belize and percentage of single mother households in the United States with a correlation coefficient (R) of -0.216 and weighted average of 7.7%. Similarly, the statistical analysis conducted on geographies consisting of 144,083,349 people shows a weak negative correlation between the proportion of Belizeans and percentage of single mother households in the United States with a correlation coefficient (R) of -0.271 and weighted average of 7.6%, a difference of 2.1%.
Single Mother Households Correlation Summary
| Measurement | Immigrants from Belize | Belizean |
| Minimum | 0.26% | 0.26% |
| Maximum | 14.5% | 13.9% |
| Range | 14.2% | 13.7% |
| Mean | 7.4% | 7.5% |
| Median | 7.4% | 7.4% |
| Interquartile 25% (IQ1) | 5.8% | 6.2% |
| Interquartile 75% (IQ3) | 9.3% | 8.5% |
| Interquartile Range (IQR) | 3.4% | 2.3% |
| Standard Deviation (Sample) | 3.0% | 2.5% |
| Standard Deviation (Population) | 2.9% | 2.5% |
Demographics Similar to Immigrants from Belize and Belizeans by Single Mother Households
In terms of single mother households, the demographic groups most similar to Immigrants from Belize are Trinidadian and Tobagonian (7.7%, a difference of 0.030%), Immigrants from Middle Africa (7.7%, a difference of 0.14%), Immigrants from Guatemala (7.7%, a difference of 0.24%), Sierra Leonean (7.7%, a difference of 0.29%), and Nigerian (7.7%, a difference of 0.60%). Similarly, the demographic groups most similar to Belizeans are Immigrants from Guyana (7.6%, a difference of 0.040%), Central American Indian (7.6%, a difference of 0.14%), Immigrants from the Azores (7.5%, a difference of 0.31%), Salvadoran (7.5%, a difference of 0.32%), and Immigrants from Cuba (7.5%, a difference of 0.40%).
| Demographics | Rating | Rank | Single Mother Households |
| Indonesians | 0.1 /100 | #268 | Tragic 7.5% |
| Somalis | 0.1 /100 | #269 | Tragic 7.5% |
| Immigrants | Cuba | 0.1 /100 | #270 | Tragic 7.5% |
| Salvadorans | 0.1 /100 | #271 | Tragic 7.5% |
| Immigrants | Azores | 0.1 /100 | #272 | Tragic 7.5% |
| Belizeans | 0.1 /100 | #273 | Tragic 7.6% |
| Immigrants | Guyana | 0.1 /100 | #274 | Tragic 7.6% |
| Central American Indians | 0.1 /100 | #275 | Tragic 7.6% |
| Guyanese | 0.1 /100 | #276 | Tragic 7.6% |
| Immigrants | Trinidad and Tobago | 0.1 /100 | #277 | Tragic 7.6% |
| Central Americans | 0.1 /100 | #278 | Tragic 7.6% |
| Immigrants | El Salvador | 0.0 /100 | #279 | Tragic 7.6% |
| Immigrants | Sierra Leone | 0.0 /100 | #280 | Tragic 7.7% |
| Immigrants | Laos | 0.0 /100 | #281 | Tragic 7.7% |
| Guatemalans | 0.0 /100 | #282 | Tragic 7.7% |
| Nigerians | 0.0 /100 | #283 | Tragic 7.7% |
| Immigrants | Belize | 0.0 /100 | #284 | Tragic 7.7% |
| Trinidadians and Tobagonians | 0.0 /100 | #285 | Tragic 7.7% |
| Immigrants | Middle Africa | 0.0 /100 | #286 | Tragic 7.7% |
| Immigrants | Guatemala | 0.0 /100 | #287 | Tragic 7.7% |
| Sierra Leoneans | 0.0 /100 | #288 | Tragic 7.7% |