Comanche vs Immigrants from Taiwan Average Family Size
COMPARE
Comanche
Immigrants from Taiwan
Average Family Size
Average Family Size Comparison
Comanche
Immigrants from Taiwan
3.25
AVERAGE FAMILY SIZE
82.8/ 100
METRIC RATING
136th/ 347
METRIC RANK
3.24
AVERAGE FAMILY SIZE
68.1/ 100
METRIC RATING
156th/ 347
METRIC RANK
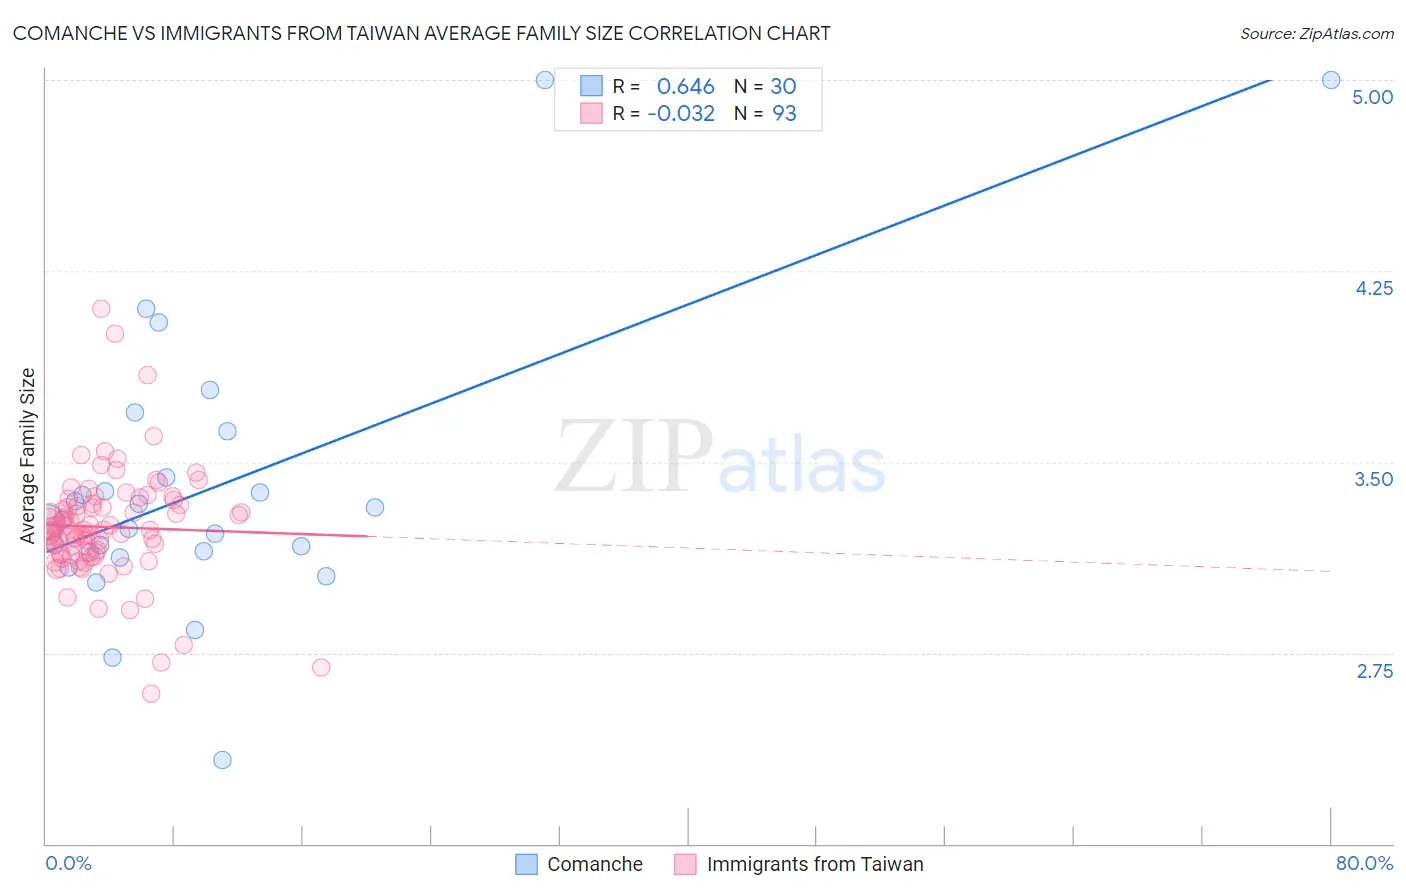
Comanche vs Immigrants from Taiwan Average Family Size Correlation Chart
The statistical analysis conducted on geographies consisting of 109,768,094 people shows a significant positive correlation between the proportion of Comanche and average family size in the United States with a correlation coefficient (R) of 0.646 and weighted average of 3.25. Similarly, the statistical analysis conducted on geographies consisting of 298,119,083 people shows no correlation between the proportion of Immigrants from Taiwan and average family size in the United States with a correlation coefficient (R) of -0.032 and weighted average of 3.24, a difference of 0.37%.
Average Family Size Correlation Summary
| Measurement | Comanche | Immigrants from Taiwan |
| Minimum | 2.33 | 2.59 |
| Maximum | 5.00 | 4.10 |
| Range | 2.67 | 1.51 |
| Mean | 3.39 | 3.24 |
| Median | 3.27 | 3.23 |
| Interquartile 25% (IQ1) | 3.14 | 3.14 |
| Interquartile 75% (IQ3) | 3.44 | 3.33 |
| Interquartile Range (IQR) | 0.30 | 0.20 |
| Standard Deviation (Sample) | 0.56 | 0.22 |
| Standard Deviation (Population) | 0.55 | 0.22 |
Demographics Similar to Comanche and Immigrants from Taiwan by Average Family Size
In terms of average family size, the demographic groups most similar to Comanche are Immigrants from Middle Africa (3.25, a difference of 0.010%), Cuban (3.25, a difference of 0.030%), Immigrants from Ethiopia (3.25, a difference of 0.040%), Subsaharan African (3.25, a difference of 0.040%), and Venezuelan (3.25, a difference of 0.040%). Similarly, the demographic groups most similar to Immigrants from Taiwan are Seminole (3.24, a difference of 0.0%), Immigrants from Egypt (3.24, a difference of 0.040%), Immigrants from Eritrea (3.24, a difference of 0.070%), Spanish American (3.24, a difference of 0.10%), and Assyrian/Chaldean/Syriac (3.24, a difference of 0.12%).
| Demographics | Rating | Rank | Average Family Size |
| Comanche | 82.8 /100 | #136 | Excellent 3.25 |
| Immigrants | Middle Africa | 82.4 /100 | #137 | Excellent 3.25 |
| Cubans | 81.8 /100 | #138 | Excellent 3.25 |
| Immigrants | Ethiopia | 81.6 /100 | #139 | Excellent 3.25 |
| Sub-Saharan Africans | 81.6 /100 | #140 | Excellent 3.25 |
| Venezuelans | 81.4 /100 | #141 | Excellent 3.25 |
| Liberians | 81.2 /100 | #142 | Excellent 3.25 |
| Bhutanese | 81.0 /100 | #143 | Excellent 3.25 |
| Tsimshian | 80.2 /100 | #144 | Excellent 3.25 |
| Armenians | 78.2 /100 | #145 | Good 3.25 |
| Immigrants | Africa | 77.9 /100 | #146 | Good 3.25 |
| Immigrants | Jordan | 75.7 /100 | #147 | Good 3.24 |
| Blackfeet | 75.0 /100 | #148 | Good 3.24 |
| Assyrians/Chaldeans/Syriacs | 73.8 /100 | #149 | Good 3.24 |
| Indians (Asian) | 73.6 /100 | #150 | Good 3.24 |
| Jordanians | 73.5 /100 | #151 | Good 3.24 |
| Spanish Americans | 72.5 /100 | #152 | Good 3.24 |
| Immigrants | Eritrea | 71.4 /100 | #153 | Good 3.24 |
| Immigrants | Egypt | 70.0 /100 | #154 | Good 3.24 |
| Seminole | 68.2 /100 | #155 | Good 3.24 |
| Immigrants | Taiwan | 68.1 /100 | #156 | Good 3.24 |