Immigrants from Eastern Africa vs Cypriot Currently Married
COMPARE
Immigrants from Eastern Africa
Cypriot
Currently Married
Currently Married Comparison
Immigrants from Eastern Africa
Cypriots
44.2%
CURRENTLY MARRIED
0.3/ 100
METRIC RATING
250th/ 347
METRIC RANK
47.8%
CURRENTLY MARRIED
93.7/ 100
METRIC RATING
103rd/ 347
METRIC RANK
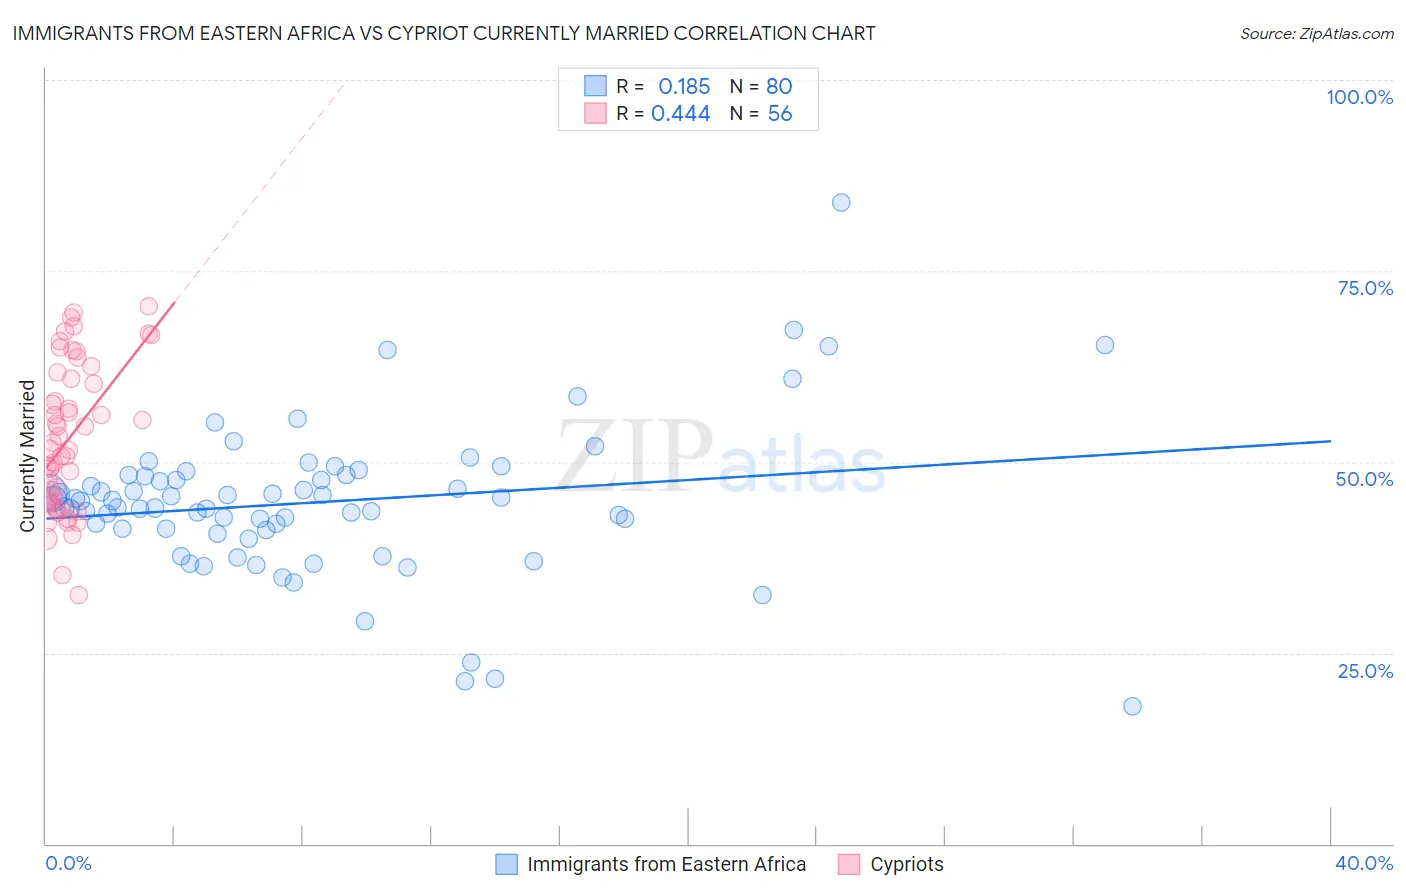
Immigrants from Eastern Africa vs Cypriot Currently Married Correlation Chart
The statistical analysis conducted on geographies consisting of 355,130,503 people shows a poor positive correlation between the proportion of Immigrants from Eastern Africa and percentage of population currently married in the United States with a correlation coefficient (R) of 0.185 and weighted average of 44.2%. Similarly, the statistical analysis conducted on geographies consisting of 61,862,826 people shows a moderate positive correlation between the proportion of Cypriots and percentage of population currently married in the United States with a correlation coefficient (R) of 0.444 and weighted average of 47.8%, a difference of 8.2%.
Currently Married Correlation Summary
| Measurement | Immigrants from Eastern Africa | Cypriot |
| Minimum | 18.0% | 32.6% |
| Maximum | 83.9% | 70.4% |
| Range | 65.9% | 37.8% |
| Mean | 44.7% | 53.2% |
| Median | 44.4% | 52.1% |
| Interquartile 25% (IQ1) | 41.2% | 44.9% |
| Interquartile 75% (IQ3) | 48.2% | 61.3% |
| Interquartile Range (IQR) | 7.0% | 16.4% |
| Standard Deviation (Sample) | 10.0% | 9.6% |
| Standard Deviation (Population) | 9.9% | 9.5% |
Similar Demographics by Currently Married
Demographics Similar to Immigrants from Eastern Africa by Currently Married
In terms of currently married, the demographic groups most similar to Immigrants from Eastern Africa are Immigrants from Cameroon (44.2%, a difference of 0.020%), Nicaraguan (44.2%, a difference of 0.040%), Blackfeet (44.2%, a difference of 0.060%), Hispanic or Latino (44.1%, a difference of 0.080%), and Ugandan (44.2%, a difference of 0.12%).
| Demographics | Rating | Rank | Currently Married |
| Immigrants | Ethiopia | 0.7 /100 | #243 | Tragic 44.5% |
| Japanese | 0.6 /100 | #244 | Tragic 44.5% |
| Immigrants | Armenia | 0.4 /100 | #245 | Tragic 44.3% |
| Immigrants | Burma/Myanmar | 0.4 /100 | #246 | Tragic 44.3% |
| Ugandans | 0.4 /100 | #247 | Tragic 44.2% |
| Nicaraguans | 0.3 /100 | #248 | Tragic 44.2% |
| Immigrants | Cameroon | 0.3 /100 | #249 | Tragic 44.2% |
| Immigrants | Eastern Africa | 0.3 /100 | #250 | Tragic 44.2% |
| Blackfeet | 0.3 /100 | #251 | Tragic 44.2% |
| Hispanics or Latinos | 0.3 /100 | #252 | Tragic 44.1% |
| Immigrants | Central America | 0.3 /100 | #253 | Tragic 44.1% |
| Vietnamese | 0.2 /100 | #254 | Tragic 44.0% |
| Yakama | 0.2 /100 | #255 | Tragic 44.0% |
| Shoshone | 0.2 /100 | #256 | Tragic 44.0% |
| Immigrants | Africa | 0.2 /100 | #257 | Tragic 43.9% |
Demographics Similar to Cypriots by Currently Married
In terms of currently married, the demographic groups most similar to Cypriots are Serbian (47.8%, a difference of 0.020%), Turkish (47.8%, a difference of 0.030%), Immigrants from Germany (47.8%, a difference of 0.050%), Celtic (47.8%, a difference of 0.070%), and Immigrants from Singapore (47.8%, a difference of 0.070%).
| Demographics | Rating | Rank | Currently Married |
| Egyptians | 94.8 /100 | #96 | Exceptional 47.9% |
| Immigrants | Ukraine | 94.8 /100 | #97 | Exceptional 47.9% |
| Immigrants | China | 94.7 /100 | #98 | Exceptional 47.9% |
| Immigrants | Sweden | 94.3 /100 | #99 | Exceptional 47.8% |
| Celtics | 94.2 /100 | #100 | Exceptional 47.8% |
| Immigrants | Germany | 94.1 /100 | #101 | Exceptional 47.8% |
| Turks | 93.9 /100 | #102 | Exceptional 47.8% |
| Cypriots | 93.7 /100 | #103 | Exceptional 47.8% |
| Serbians | 93.6 /100 | #104 | Exceptional 47.8% |
| Immigrants | Singapore | 93.3 /100 | #105 | Exceptional 47.8% |
| Immigrants | Greece | 93.1 /100 | #106 | Exceptional 47.7% |
| Immigrants | Italy | 92.9 /100 | #107 | Exceptional 47.7% |
| Tsimshian | 92.4 /100 | #108 | Exceptional 47.7% |
| Immigrants | Egypt | 92.3 /100 | #109 | Exceptional 47.7% |
| Immigrants | Russia | 92.0 /100 | #110 | Exceptional 47.7% |