Czech vs Immigrants from India Births to Unmarried Women
COMPARE
Czech
Immigrants from India
Births to Unmarried Women
Births to Unmarried Women Comparison
Czechs
Immigrants from India
30.5%
BIRTHS TO UNMARRIED WOMEN
82.1/ 100
METRIC RATING
144th/ 347
METRIC RANK
22.9%
BIRTHS TO UNMARRIED WOMEN
100.0/ 100
METRIC RATING
2nd/ 347
METRIC RANK
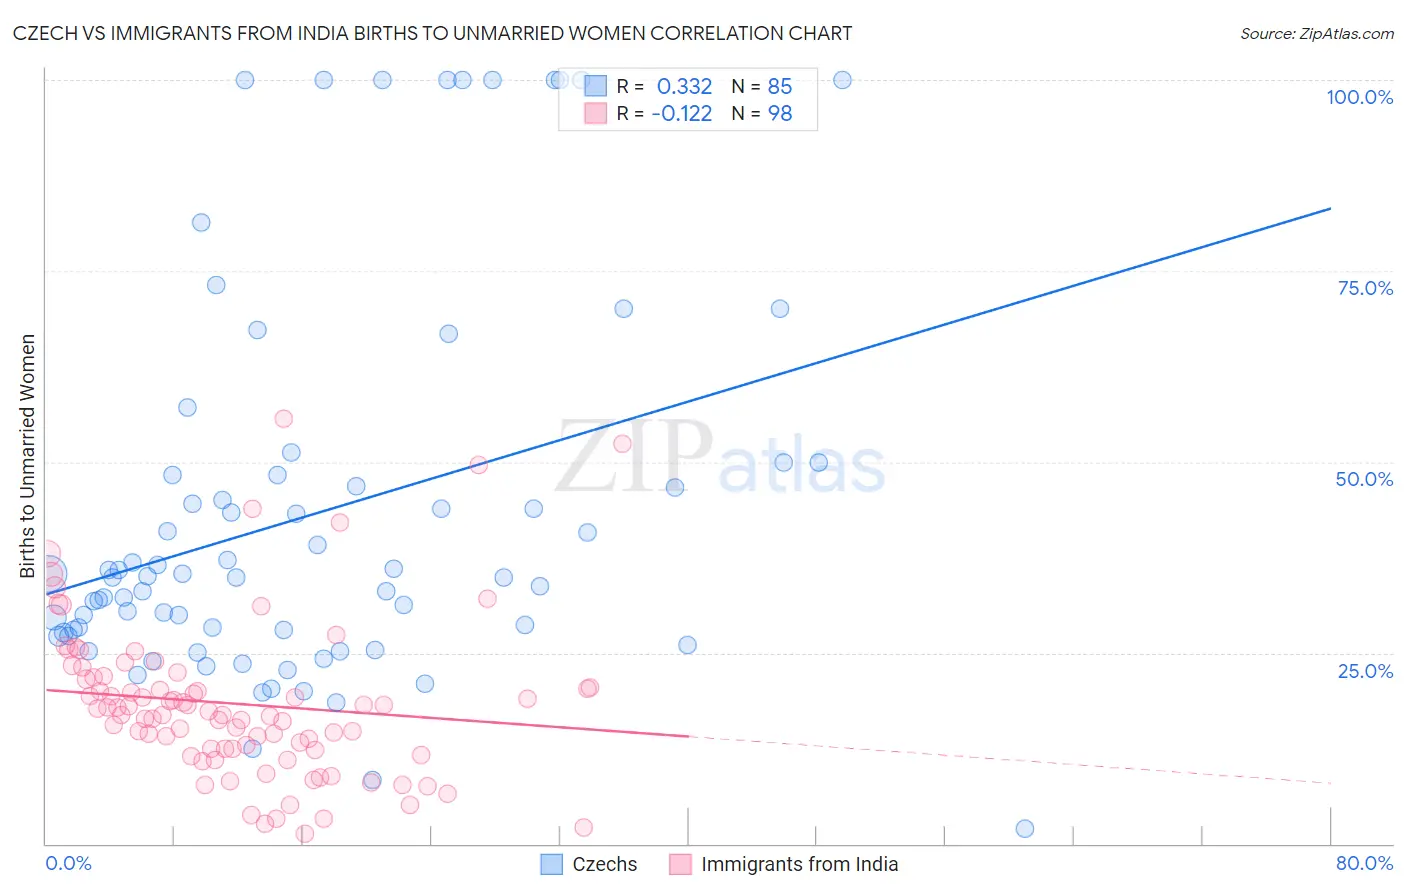
Czech vs Immigrants from India Births to Unmarried Women Correlation Chart
The statistical analysis conducted on geographies consisting of 439,200,510 people shows a mild positive correlation between the proportion of Czechs and percentage of births to unmarried women in the United States with a correlation coefficient (R) of 0.332 and weighted average of 30.5%. Similarly, the statistical analysis conducted on geographies consisting of 401,508,403 people shows a poor negative correlation between the proportion of Immigrants from India and percentage of births to unmarried women in the United States with a correlation coefficient (R) of -0.122 and weighted average of 22.9%, a difference of 33.4%.
Births to Unmarried Women Correlation Summary
| Measurement | Czech | Immigrants from India |
| Minimum | 1.9% | 1.3% |
| Maximum | 100.0% | 55.7% |
| Range | 98.1% | 54.4% |
| Mean | 43.1% | 18.3% |
| Median | 34.9% | 17.1% |
| Interquartile 25% (IQ1) | 27.4% | 12.4% |
| Interquartile 75% (IQ3) | 48.3% | 21.8% |
| Interquartile Range (IQR) | 20.8% | 9.4% |
| Standard Deviation (Sample) | 25.0% | 10.3% |
| Standard Deviation (Population) | 24.9% | 10.3% |
Similar Demographics by Births to Unmarried Women
Demographics Similar to Czechs by Births to Unmarried Women
In terms of births to unmarried women, the demographic groups most similar to Czechs are Immigrants from Uganda (30.5%, a difference of 0.070%), South African (30.5%, a difference of 0.090%), Immigrants from North America (30.6%, a difference of 0.10%), Northern European (30.6%, a difference of 0.13%), and Pakistani (30.5%, a difference of 0.15%).
| Demographics | Rating | Rank | Births to Unmarried Women |
| Immigrants | Philippines | 83.9 /100 | #137 | Excellent 30.4% |
| Puget Sound Salish | 83.9 /100 | #138 | Excellent 30.4% |
| Immigrants | Canada | 83.7 /100 | #139 | Excellent 30.4% |
| Swiss | 83.1 /100 | #140 | Excellent 30.5% |
| Pakistanis | 83.0 /100 | #141 | Excellent 30.5% |
| South Africans | 82.7 /100 | #142 | Excellent 30.5% |
| Immigrants | Uganda | 82.6 /100 | #143 | Excellent 30.5% |
| Czechs | 82.1 /100 | #144 | Excellent 30.5% |
| Immigrants | North America | 81.5 /100 | #145 | Excellent 30.6% |
| Northern Europeans | 81.4 /100 | #146 | Excellent 30.6% |
| Immigrants | Oceania | 81.2 /100 | #147 | Excellent 30.6% |
| Chileans | 79.1 /100 | #148 | Good 30.7% |
| Serbians | 78.8 /100 | #149 | Good 30.7% |
| Somalis | 77.8 /100 | #150 | Good 30.7% |
| Italians | 77.0 /100 | #151 | Good 30.8% |
Demographics Similar to Immigrants from India by Births to Unmarried Women
In terms of births to unmarried women, the demographic groups most similar to Immigrants from India are Filipino (23.0%, a difference of 0.38%), Immigrants from Taiwan (23.0%, a difference of 0.52%), Immigrants from Hong Kong (23.6%, a difference of 3.0%), Assyrian/Chaldean/Syriac (22.0%, a difference of 4.2%), and Immigrants from Iran (24.0%, a difference of 4.6%).
| Demographics | Rating | Rank | Births to Unmarried Women |
| Assyrians/Chaldeans/Syriacs | 100.0 /100 | #1 | Exceptional 22.0% |
| Immigrants | India | 100.0 /100 | #2 | Exceptional 22.9% |
| Filipinos | 100.0 /100 | #3 | Exceptional 23.0% |
| Immigrants | Taiwan | 100.0 /100 | #4 | Exceptional 23.0% |
| Immigrants | Hong Kong | 100.0 /100 | #5 | Exceptional 23.6% |
| Immigrants | Iran | 100.0 /100 | #6 | Exceptional 24.0% |
| Thais | 100.0 /100 | #7 | Exceptional 24.0% |
| Immigrants | China | 100.0 /100 | #8 | Exceptional 24.7% |
| Immigrants | South Central Asia | 100.0 /100 | #9 | Exceptional 24.7% |
| Immigrants | Eastern Asia | 100.0 /100 | #10 | Exceptional 25.0% |
| Immigrants | Israel | 100.0 /100 | #11 | Exceptional 25.1% |
| Indians (Asian) | 100.0 /100 | #12 | Exceptional 25.3% |
| Iranians | 100.0 /100 | #13 | Exceptional 25.3% |
| Immigrants | Lebanon | 100.0 /100 | #14 | Exceptional 25.3% |
| Immigrants | Singapore | 100.0 /100 | #15 | Exceptional 25.6% |