Comanche vs Immigrants from Sweden Births to Unmarried Women
COMPARE
Comanche
Immigrants from Sweden
Births to Unmarried Women
Births to Unmarried Women Comparison
Comanche
Immigrants from Sweden
36.7%
BIRTHS TO UNMARRIED WOMEN
0.1/ 100
METRIC RATING
268th/ 347
METRIC RANK
28.5%
BIRTHS TO UNMARRIED WOMEN
98.5/ 100
METRIC RATING
72nd/ 347
METRIC RANK
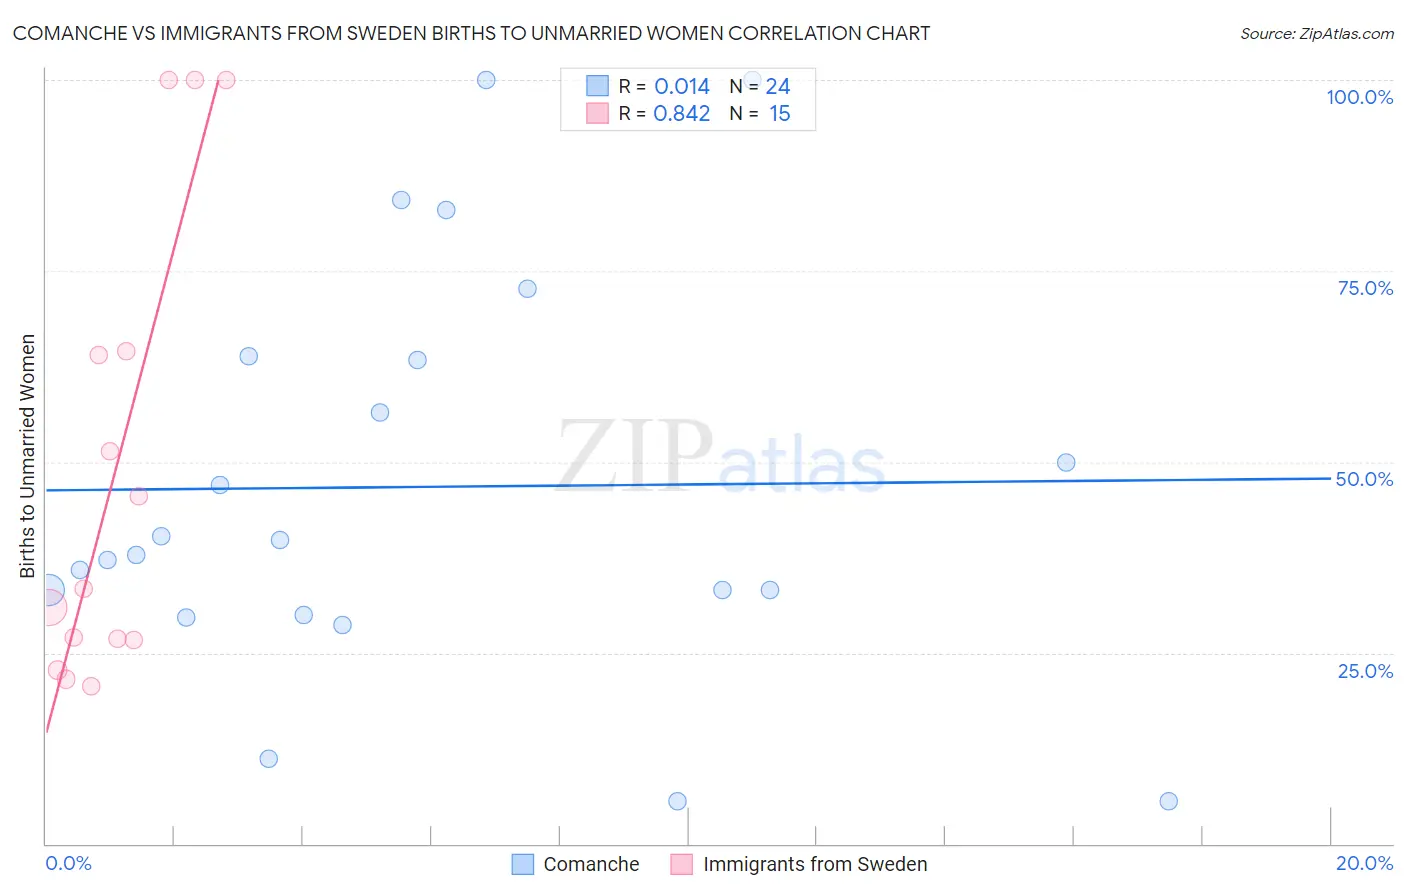
Comanche vs Immigrants from Sweden Births to Unmarried Women Correlation Chart
The statistical analysis conducted on geographies consisting of 107,692,216 people shows no correlation between the proportion of Comanche and percentage of births to unmarried women in the United States with a correlation coefficient (R) of 0.014 and weighted average of 36.7%. Similarly, the statistical analysis conducted on geographies consisting of 155,904,998 people shows a very strong positive correlation between the proportion of Immigrants from Sweden and percentage of births to unmarried women in the United States with a correlation coefficient (R) of 0.842 and weighted average of 28.5%, a difference of 28.7%.
Births to Unmarried Women Correlation Summary
| Measurement | Comanche | Immigrants from Sweden |
| Minimum | 5.6% | 20.6% |
| Maximum | 100.0% | 100.0% |
| Range | 94.4% | 79.4% |
| Mean | 46.7% | 49.0% |
| Median | 38.8% | 33.4% |
| Interquartile 25% (IQ1) | 31.6% | 26.6% |
| Interquartile 75% (IQ3) | 63.6% | 64.5% |
| Interquartile Range (IQR) | 32.0% | 37.9% |
| Standard Deviation (Sample) | 26.6% | 30.0% |
| Standard Deviation (Population) | 26.0% | 29.0% |
Similar Demographics by Births to Unmarried Women
Demographics Similar to Comanche by Births to Unmarried Women
In terms of births to unmarried women, the demographic groups most similar to Comanche are Central American (36.7%, a difference of 0.010%), Immigrants from Senegal (36.7%, a difference of 0.080%), Senegalese (36.8%, a difference of 0.12%), Cherokee (36.7%, a difference of 0.13%), and Subsaharan African (36.7%, a difference of 0.18%).
| Demographics | Rating | Rank | Births to Unmarried Women |
| Trinidadians and Tobagonians | 0.2 /100 | #261 | Tragic 36.5% |
| French American Indians | 0.1 /100 | #262 | Tragic 36.6% |
| Nicaraguans | 0.1 /100 | #263 | Tragic 36.6% |
| Sub-Saharan Africans | 0.1 /100 | #264 | Tragic 36.7% |
| Cherokee | 0.1 /100 | #265 | Tragic 36.7% |
| Immigrants | Senegal | 0.1 /100 | #266 | Tragic 36.7% |
| Central Americans | 0.1 /100 | #267 | Tragic 36.7% |
| Comanche | 0.1 /100 | #268 | Tragic 36.7% |
| Senegalese | 0.1 /100 | #269 | Tragic 36.8% |
| Immigrants | Congo | 0.1 /100 | #270 | Tragic 36.8% |
| Immigrants | Barbados | 0.1 /100 | #271 | Tragic 36.8% |
| Choctaw | 0.1 /100 | #272 | Tragic 36.9% |
| Mexicans | 0.1 /100 | #273 | Tragic 36.9% |
| Cree | 0.1 /100 | #274 | Tragic 37.0% |
| Barbadians | 0.1 /100 | #275 | Tragic 37.0% |
Demographics Similar to Immigrants from Sweden by Births to Unmarried Women
In terms of births to unmarried women, the demographic groups most similar to Immigrants from Sweden are Albanian (28.5%, a difference of 0.050%), Jordanian (28.5%, a difference of 0.060%), Immigrants from Bolivia (28.6%, a difference of 0.070%), Immigrants from Switzerland (28.6%, a difference of 0.16%), and Israeli (28.6%, a difference of 0.18%).
| Demographics | Rating | Rank | Births to Unmarried Women |
| Immigrants | Czechoslovakia | 98.8 /100 | #65 | Exceptional 28.4% |
| Immigrants | Egypt | 98.8 /100 | #66 | Exceptional 28.4% |
| Palestinians | 98.7 /100 | #67 | Exceptional 28.4% |
| Immigrants | Europe | 98.7 /100 | #68 | Exceptional 28.4% |
| Bolivians | 98.7 /100 | #69 | Exceptional 28.5% |
| Laotians | 98.6 /100 | #70 | Exceptional 28.5% |
| Jordanians | 98.5 /100 | #71 | Exceptional 28.5% |
| Immigrants | Sweden | 98.5 /100 | #72 | Exceptional 28.5% |
| Albanians | 98.5 /100 | #73 | Exceptional 28.5% |
| Immigrants | Bolivia | 98.5 /100 | #74 | Exceptional 28.6% |
| Immigrants | Switzerland | 98.4 /100 | #75 | Exceptional 28.6% |
| Israelis | 98.4 /100 | #76 | Exceptional 28.6% |
| Immigrants | Northern Europe | 98.3 /100 | #77 | Exceptional 28.6% |
| Zimbabweans | 98.2 /100 | #78 | Exceptional 28.7% |
| Danes | 98.2 /100 | #79 | Exceptional 28.7% |