Comanche vs Immigrants from Sweden Seniors Poverty Over the Age of 65
COMPARE
Comanche
Immigrants from Sweden
Seniors Poverty Over the Age of 65
Seniors Poverty Over the Age of 65 Comparison
Comanche
Immigrants from Sweden
12.1%
SENIORS POVERTY OVER THE AGE OF 65
0.9/ 100
METRIC RATING
240th/ 347
METRIC RANK
10.1%
SENIORS POVERTY OVER THE AGE OF 65
96.7/ 100
METRIC RATING
93rd/ 347
METRIC RANK
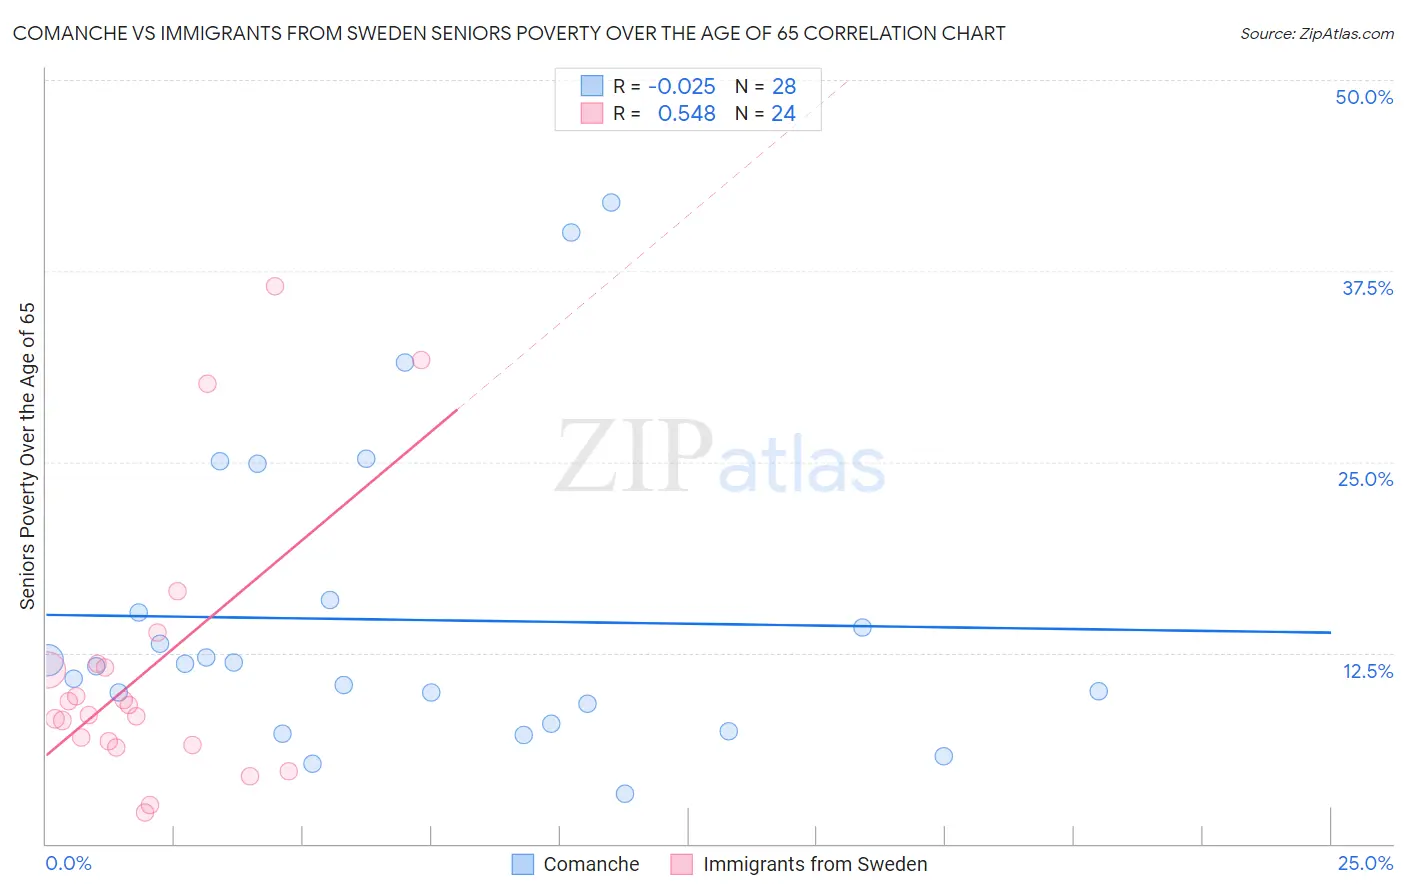
Comanche vs Immigrants from Sweden Seniors Poverty Over the Age of 65 Correlation Chart
The statistical analysis conducted on geographies consisting of 109,585,946 people shows no correlation between the proportion of Comanche and poverty level among seniors over the age of 65 in the United States with a correlation coefficient (R) of -0.025 and weighted average of 12.1%. Similarly, the statistical analysis conducted on geographies consisting of 164,561,963 people shows a substantial positive correlation between the proportion of Immigrants from Sweden and poverty level among seniors over the age of 65 in the United States with a correlation coefficient (R) of 0.548 and weighted average of 10.1%, a difference of 19.4%.
Seniors Poverty Over the Age of 65 Correlation Summary
| Measurement | Comanche | Immigrants from Sweden |
| Minimum | 3.3% | 2.0% |
| Maximum | 42.0% | 36.5% |
| Range | 38.7% | 34.4% |
| Mean | 14.7% | 11.4% |
| Median | 11.7% | 8.7% |
| Interquartile 25% (IQ1) | 8.5% | 6.6% |
| Interquartile 75% (IQ3) | 15.6% | 11.7% |
| Interquartile Range (IQR) | 7.1% | 5.1% |
| Standard Deviation (Sample) | 10.0% | 8.9% |
| Standard Deviation (Population) | 9.8% | 8.7% |
Similar Demographics by Seniors Poverty Over the Age of 65
Demographics Similar to Comanche by Seniors Poverty Over the Age of 65
In terms of seniors poverty over the age of 65, the demographic groups most similar to Comanche are Immigrants from Albania (12.1%, a difference of 0.020%), Subsaharan African (12.1%, a difference of 0.060%), Immigrants from Spain (12.1%, a difference of 0.10%), Uruguayan (12.1%, a difference of 0.18%), and Seminole (12.0%, a difference of 0.36%).
| Demographics | Rating | Rank | Seniors Poverty Over the Age of 65 |
| Panamanians | 1.8 /100 | #233 | Tragic 11.9% |
| Iroquois | 1.7 /100 | #234 | Tragic 11.9% |
| Immigrants | Argentina | 1.3 /100 | #235 | Tragic 12.0% |
| Immigrants | Peru | 1.3 /100 | #236 | Tragic 12.0% |
| Moroccans | 1.2 /100 | #237 | Tragic 12.0% |
| Seminole | 1.1 /100 | #238 | Tragic 12.0% |
| Immigrants | Spain | 1.0 /100 | #239 | Tragic 12.1% |
| Comanche | 0.9 /100 | #240 | Tragic 12.1% |
| Immigrants | Albania | 0.9 /100 | #241 | Tragic 12.1% |
| Sub-Saharan Africans | 0.9 /100 | #242 | Tragic 12.1% |
| Uruguayans | 0.8 /100 | #243 | Tragic 12.1% |
| Immigrants | Portugal | 0.8 /100 | #244 | Tragic 12.1% |
| Chippewa | 0.7 /100 | #245 | Tragic 12.1% |
| Cree | 0.7 /100 | #246 | Tragic 12.1% |
| Japanese | 0.6 /100 | #247 | Tragic 12.2% |
Demographics Similar to Immigrants from Sweden by Seniors Poverty Over the Age of 65
In terms of seniors poverty over the age of 65, the demographic groups most similar to Immigrants from Sweden are Immigrants from Germany (10.1%, a difference of 0.070%), Immigrants from Singapore (10.1%, a difference of 0.11%), Puget Sound Salish (10.1%, a difference of 0.13%), Ukrainian (10.1%, a difference of 0.15%), and Immigrants from Bulgaria (10.1%, a difference of 0.21%).
| Demographics | Rating | Rank | Seniors Poverty Over the Age of 65 |
| Romanians | 97.2 /100 | #86 | Exceptional 10.1% |
| Burmese | 97.2 /100 | #87 | Exceptional 10.1% |
| Jordanians | 97.1 /100 | #88 | Exceptional 10.1% |
| Immigrants | Bulgaria | 97.0 /100 | #89 | Exceptional 10.1% |
| Ukrainians | 96.9 /100 | #90 | Exceptional 10.1% |
| Puget Sound Salish | 96.9 /100 | #91 | Exceptional 10.1% |
| Immigrants | Singapore | 96.9 /100 | #92 | Exceptional 10.1% |
| Immigrants | Sweden | 96.7 /100 | #93 | Exceptional 10.1% |
| Immigrants | Germany | 96.7 /100 | #94 | Exceptional 10.1% |
| Immigrants | Japan | 96.3 /100 | #95 | Exceptional 10.1% |
| Basques | 95.9 /100 | #96 | Exceptional 10.2% |
| Immigrants | Pakistan | 95.7 /100 | #97 | Exceptional 10.2% |
| Immigrants | Kuwait | 95.5 /100 | #98 | Exceptional 10.2% |
| Cypriots | 95.5 /100 | #99 | Exceptional 10.2% |
| Marshallese | 95.3 /100 | #100 | Exceptional 10.2% |