Canadian vs Colville Average Family Size
COMPARE
Canadian
Colville
Average Family Size
Average Family Size Comparison
Canadians
Colville
3.14
AVERAGE FAMILY SIZE
0.2/ 100
METRIC RATING
299th/ 347
METRIC RANK
3.14
AVERAGE FAMILY SIZE
0.2/ 100
METRIC RATING
298th/ 347
METRIC RANK
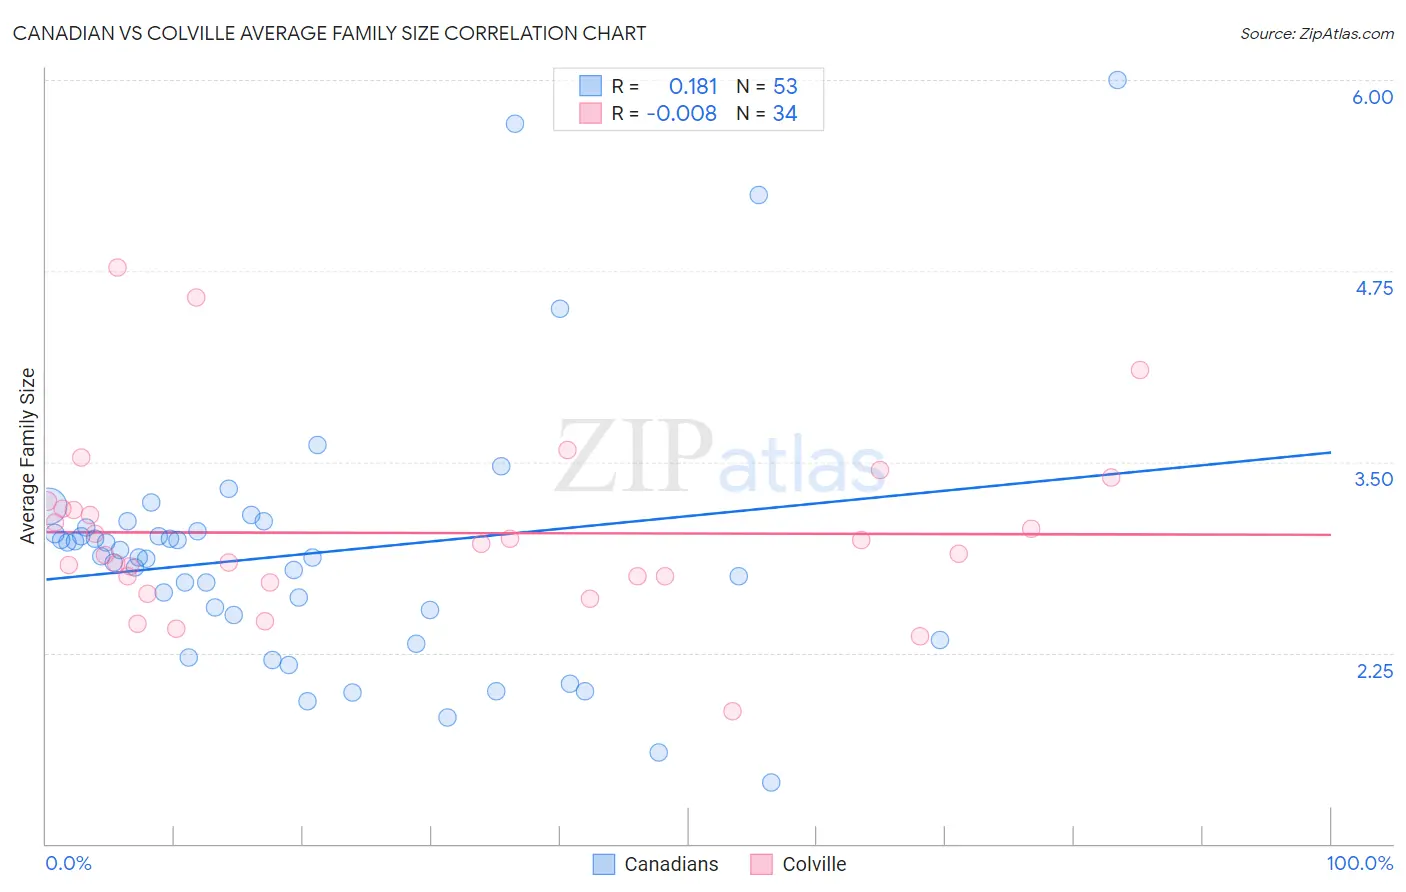
Canadian vs Colville Average Family Size Correlation Chart
The statistical analysis conducted on geographies consisting of 437,289,019 people shows a poor positive correlation between the proportion of Canadians and average family size in the United States with a correlation coefficient (R) of 0.181 and weighted average of 3.14. Similarly, the statistical analysis conducted on geographies consisting of 34,682,970 people shows no correlation between the proportion of Colville and average family size in the United States with a correlation coefficient (R) of -0.008 and weighted average of 3.14, a difference of 0.050%.
Average Family Size Correlation Summary
| Measurement | Canadian | Colville |
| Minimum | 1.40 | 1.87 |
| Maximum | 6.00 | 4.77 |
| Range | 4.60 | 2.90 |
| Mean | 2.90 | 3.03 |
| Median | 2.87 | 2.93 |
| Interquartile 25% (IQ1) | 2.42 | 2.75 |
| Interquartile 75% (IQ3) | 3.06 | 3.20 |
| Interquartile Range (IQR) | 0.64 | 0.45 |
| Standard Deviation (Sample) | 0.87 | 0.58 |
| Standard Deviation (Population) | 0.86 | 0.58 |
Demographics Similar to Canadians and Colville by Average Family Size
In terms of average family size, the demographic groups most similar to Canadians are Immigrants from Sweden (3.14, a difference of 0.010%), Austrian (3.14, a difference of 0.050%), Ukrainian (3.14, a difference of 0.050%), Immigrants from Western Europe (3.14, a difference of 0.050%), and Immigrants from Croatia (3.14, a difference of 0.060%). Similarly, the demographic groups most similar to Colville are Immigrants from Western Europe (3.14, a difference of 0.0%), Immigrants from Croatia (3.14, a difference of 0.010%), Austrian (3.14, a difference of 0.010%), Ukrainian (3.14, a difference of 0.010%), and Scandinavian (3.14, a difference of 0.030%).
| Demographics | Rating | Rank | Average Family Size |
| Immigrants | Czechoslovakia | 0.3 /100 | #288 | Tragic 3.14 |
| Immigrants | Norway | 0.3 /100 | #289 | Tragic 3.14 |
| Cypriots | 0.3 /100 | #290 | Tragic 3.14 |
| Alsatians | 0.2 /100 | #291 | Tragic 3.14 |
| Europeans | 0.2 /100 | #292 | Tragic 3.14 |
| Scandinavians | 0.2 /100 | #293 | Tragic 3.14 |
| Immigrants | Croatia | 0.2 /100 | #294 | Tragic 3.14 |
| Austrians | 0.2 /100 | #295 | Tragic 3.14 |
| Ukrainians | 0.2 /100 | #296 | Tragic 3.14 |
| Immigrants | Western Europe | 0.2 /100 | #297 | Tragic 3.14 |
| Colville | 0.2 /100 | #298 | Tragic 3.14 |
| Canadians | 0.2 /100 | #299 | Tragic 3.14 |
| Immigrants | Sweden | 0.2 /100 | #300 | Tragic 3.14 |
| Macedonians | 0.2 /100 | #301 | Tragic 3.13 |
| Immigrants | Latvia | 0.2 /100 | #302 | Tragic 3.13 |
| British | 0.2 /100 | #303 | Tragic 3.13 |
| Immigrants | Switzerland | 0.2 /100 | #304 | Tragic 3.13 |
| Australians | 0.1 /100 | #305 | Tragic 3.13 |
| Immigrants | Ireland | 0.1 /100 | #306 | Tragic 3.13 |
| Immigrants | Serbia | 0.1 /100 | #307 | Tragic 3.13 |
| Slavs | 0.1 /100 | #308 | Tragic 3.13 |