Canadian vs Greek Average Family Size
COMPARE
Canadian
Greek
Average Family Size
Average Family Size Comparison
Canadians
Greeks
3.14
AVERAGE FAMILY SIZE
0.2/ 100
METRIC RATING
299th/ 347
METRIC RANK
3.14
AVERAGE FAMILY SIZE
0.3/ 100
METRIC RATING
287th/ 347
METRIC RANK
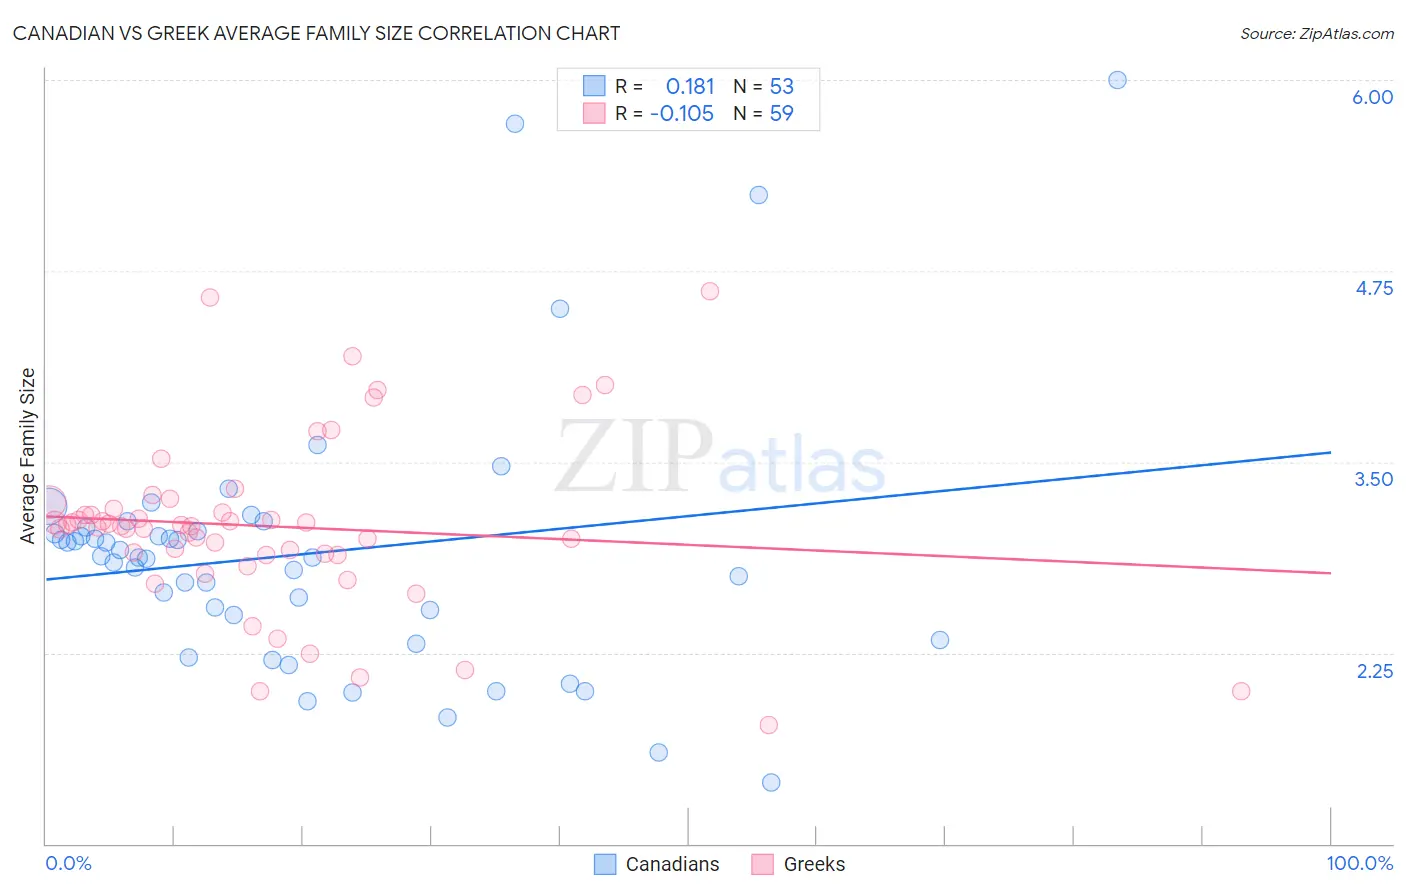
Canadian vs Greek Average Family Size Correlation Chart
The statistical analysis conducted on geographies consisting of 437,289,019 people shows a poor positive correlation between the proportion of Canadians and average family size in the United States with a correlation coefficient (R) of 0.181 and weighted average of 3.14. Similarly, the statistical analysis conducted on geographies consisting of 482,359,857 people shows a poor negative correlation between the proportion of Greeks and average family size in the United States with a correlation coefficient (R) of -0.105 and weighted average of 3.14, a difference of 0.18%.
Average Family Size Correlation Summary
| Measurement | Canadian | Greek |
| Minimum | 1.40 | 1.78 |
| Maximum | 6.00 | 4.62 |
| Range | 4.60 | 2.84 |
| Mean | 2.90 | 3.08 |
| Median | 2.87 | 3.08 |
| Interquartile 25% (IQ1) | 2.42 | 2.89 |
| Interquartile 75% (IQ3) | 3.06 | 3.19 |
| Interquartile Range (IQR) | 0.64 | 0.30 |
| Standard Deviation (Sample) | 0.87 | 0.56 |
| Standard Deviation (Population) | 0.86 | 0.56 |
Demographics Similar to Canadians and Greeks by Average Family Size
In terms of average family size, the demographic groups most similar to Canadians are Immigrants from Sweden (3.14, a difference of 0.010%), Austrian (3.14, a difference of 0.050%), Ukrainian (3.14, a difference of 0.050%), Immigrants from Western Europe (3.14, a difference of 0.050%), and Colville (3.14, a difference of 0.050%). Similarly, the demographic groups most similar to Greeks are Immigrants from Czechoslovakia (3.14, a difference of 0.0%), Immigrants from Norway (3.14, a difference of 0.0%), Immigrants from Netherlands (3.14, a difference of 0.010%), Cypriot (3.14, a difference of 0.030%), and White/Caucasian (3.14, a difference of 0.060%).
| Demographics | Rating | Rank | Average Family Size |
| German Russians | 0.4 /100 | #283 | Tragic 3.15 |
| Immigrants | France | 0.4 /100 | #284 | Tragic 3.15 |
| Whites/Caucasians | 0.3 /100 | #285 | Tragic 3.14 |
| Immigrants | Netherlands | 0.3 /100 | #286 | Tragic 3.14 |
| Greeks | 0.3 /100 | #287 | Tragic 3.14 |
| Immigrants | Czechoslovakia | 0.3 /100 | #288 | Tragic 3.14 |
| Immigrants | Norway | 0.3 /100 | #289 | Tragic 3.14 |
| Cypriots | 0.3 /100 | #290 | Tragic 3.14 |
| Alsatians | 0.2 /100 | #291 | Tragic 3.14 |
| Europeans | 0.2 /100 | #292 | Tragic 3.14 |
| Scandinavians | 0.2 /100 | #293 | Tragic 3.14 |
| Immigrants | Croatia | 0.2 /100 | #294 | Tragic 3.14 |
| Austrians | 0.2 /100 | #295 | Tragic 3.14 |
| Ukrainians | 0.2 /100 | #296 | Tragic 3.14 |
| Immigrants | Western Europe | 0.2 /100 | #297 | Tragic 3.14 |
| Colville | 0.2 /100 | #298 | Tragic 3.14 |
| Canadians | 0.2 /100 | #299 | Tragic 3.14 |
| Immigrants | Sweden | 0.2 /100 | #300 | Tragic 3.14 |
| Macedonians | 0.2 /100 | #301 | Tragic 3.13 |
| Immigrants | Latvia | 0.2 /100 | #302 | Tragic 3.13 |
| British | 0.2 /100 | #303 | Tragic 3.13 |