British West Indian vs Immigrants from Portugal Married-couple Households
COMPARE
British West Indian
Immigrants from Portugal
Married-couple Households
Married-couple Households Comparison
British West Indians
Immigrants from Portugal
38.3%
MARRIED-COUPLE HOUSEHOLDS
0.0/ 100
METRIC RATING
339th/ 347
METRIC RANK
45.2%
MARRIED-COUPLE HOUSEHOLDS
5.6/ 100
METRIC RATING
216th/ 347
METRIC RANK
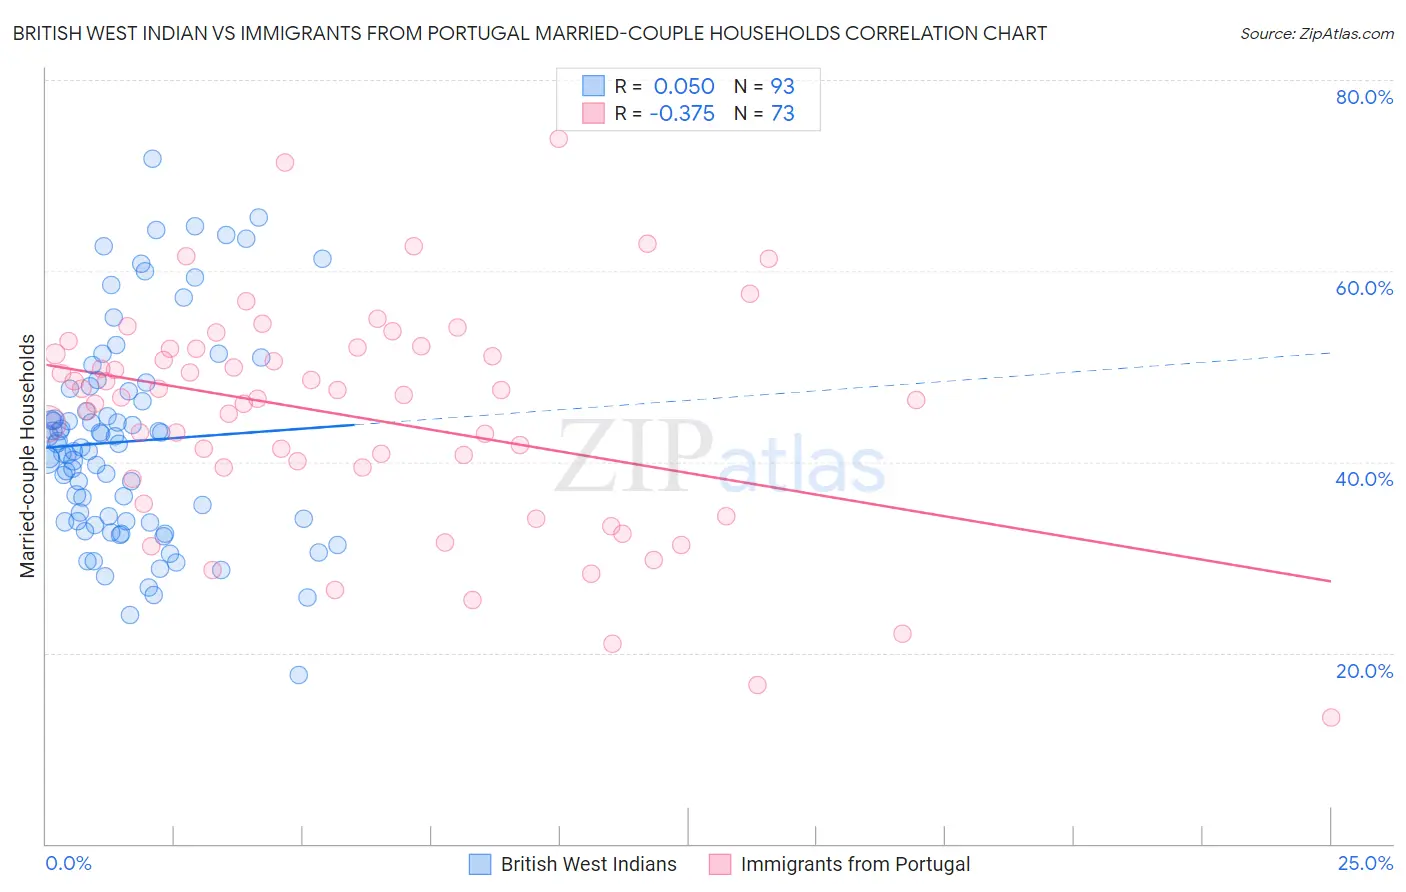
British West Indian vs Immigrants from Portugal Married-couple Households Correlation Chart
The statistical analysis conducted on geographies consisting of 152,632,220 people shows no correlation between the proportion of British West Indians and percentage of married-couple family households in the United States with a correlation coefficient (R) of 0.050 and weighted average of 38.3%. Similarly, the statistical analysis conducted on geographies consisting of 174,766,894 people shows a mild negative correlation between the proportion of Immigrants from Portugal and percentage of married-couple family households in the United States with a correlation coefficient (R) of -0.375 and weighted average of 45.2%, a difference of 18.0%.
Married-couple Households Correlation Summary
| Measurement | British West Indian | Immigrants from Portugal |
| Minimum | 17.7% | 13.2% |
| Maximum | 71.8% | 73.9% |
| Range | 54.1% | 60.7% |
| Mean | 42.1% | 44.7% |
| Median | 41.5% | 46.8% |
| Interquartile 25% (IQ1) | 33.7% | 38.8% |
| Interquartile 75% (IQ3) | 47.6% | 51.9% |
| Interquartile Range (IQR) | 13.8% | 13.1% |
| Standard Deviation (Sample) | 10.9% | 11.7% |
| Standard Deviation (Population) | 10.8% | 11.6% |
Similar Demographics by Married-couple Households
Demographics Similar to British West Indians by Married-couple Households
In terms of married-couple households, the demographic groups most similar to British West Indians are Immigrants from Senegal (38.4%, a difference of 0.13%), Immigrants from Somalia (38.4%, a difference of 0.29%), Dominican (38.2%, a difference of 0.38%), Black/African American (38.5%, a difference of 0.43%), and Cape Verdean (38.1%, a difference of 0.51%).
| Demographics | Rating | Rank | Married-couple Households |
| Somalis | 0.0 /100 | #332 | Tragic 39.0% |
| Immigrants | West Indies | 0.0 /100 | #333 | Tragic 39.0% |
| Immigrants | St. Vincent and the Grenadines | 0.0 /100 | #334 | Tragic 38.7% |
| Senegalese | 0.0 /100 | #335 | Tragic 38.6% |
| Blacks/African Americans | 0.0 /100 | #336 | Tragic 38.5% |
| Immigrants | Somalia | 0.0 /100 | #337 | Tragic 38.4% |
| Immigrants | Senegal | 0.0 /100 | #338 | Tragic 38.4% |
| British West Indians | 0.0 /100 | #339 | Tragic 38.3% |
| Dominicans | 0.0 /100 | #340 | Tragic 38.2% |
| Cape Verdeans | 0.0 /100 | #341 | Tragic 38.1% |
| Tohono O'odham | 0.0 /100 | #342 | Tragic 37.9% |
| Immigrants | Grenada | 0.0 /100 | #343 | Tragic 37.5% |
| Immigrants | Dominican Republic | 0.0 /100 | #344 | Tragic 37.3% |
| Hopi | 0.0 /100 | #345 | Tragic 36.7% |
| Immigrants | Cabo Verde | 0.0 /100 | #346 | Tragic 36.2% |
Demographics Similar to Immigrants from Portugal by Married-couple Households
In terms of married-couple households, the demographic groups most similar to Immigrants from Portugal are Immigrants from Nepal (45.2%, a difference of 0.0%), Japanese (45.2%, a difference of 0.020%), Panamanian (45.2%, a difference of 0.020%), Yakama (45.2%, a difference of 0.050%), and Immigrants from the Azores (45.2%, a difference of 0.050%).
| Demographics | Rating | Rank | Married-couple Households |
| Immigrants | Uzbekistan | 8.4 /100 | #209 | Tragic 45.4% |
| Cubans | 7.7 /100 | #210 | Tragic 45.4% |
| Immigrants | Spain | 7.3 /100 | #211 | Tragic 45.3% |
| Creek | 6.4 /100 | #212 | Tragic 45.3% |
| Yakama | 5.8 /100 | #213 | Tragic 45.2% |
| Japanese | 5.7 /100 | #214 | Tragic 45.2% |
| Immigrants | Nepal | 5.6 /100 | #215 | Tragic 45.2% |
| Immigrants | Portugal | 5.6 /100 | #216 | Tragic 45.2% |
| Panamanians | 5.5 /100 | #217 | Tragic 45.2% |
| Immigrants | Azores | 5.3 /100 | #218 | Tragic 45.2% |
| Nicaraguans | 5.3 /100 | #219 | Tragic 45.2% |
| Immigrants | Thailand | 5.1 /100 | #220 | Tragic 45.2% |
| Tlingit-Haida | 4.9 /100 | #221 | Tragic 45.1% |
| Immigrants | Laos | 4.6 /100 | #222 | Tragic 45.1% |
| Immigrants | Cambodia | 2.7 /100 | #223 | Tragic 44.9% |