Bangladeshi vs Immigrants from Eastern Africa Unemployment Among Seniors over 75 years
COMPARE
Bangladeshi
Immigrants from Eastern Africa
Unemployment Among Seniors over 75 years
Unemployment Among Seniors over 75 years Comparison
Bangladeshis
Immigrants from Eastern Africa
9.6%
UNEMPLOYMENT AMONG SENIORS OVER 75 YEARS
0.1/ 100
METRIC RATING
281st/ 347
METRIC RANK
8.7%
UNEMPLOYMENT AMONG SENIORS OVER 75 YEARS
57.6/ 100
METRIC RATING
167th/ 347
METRIC RANK
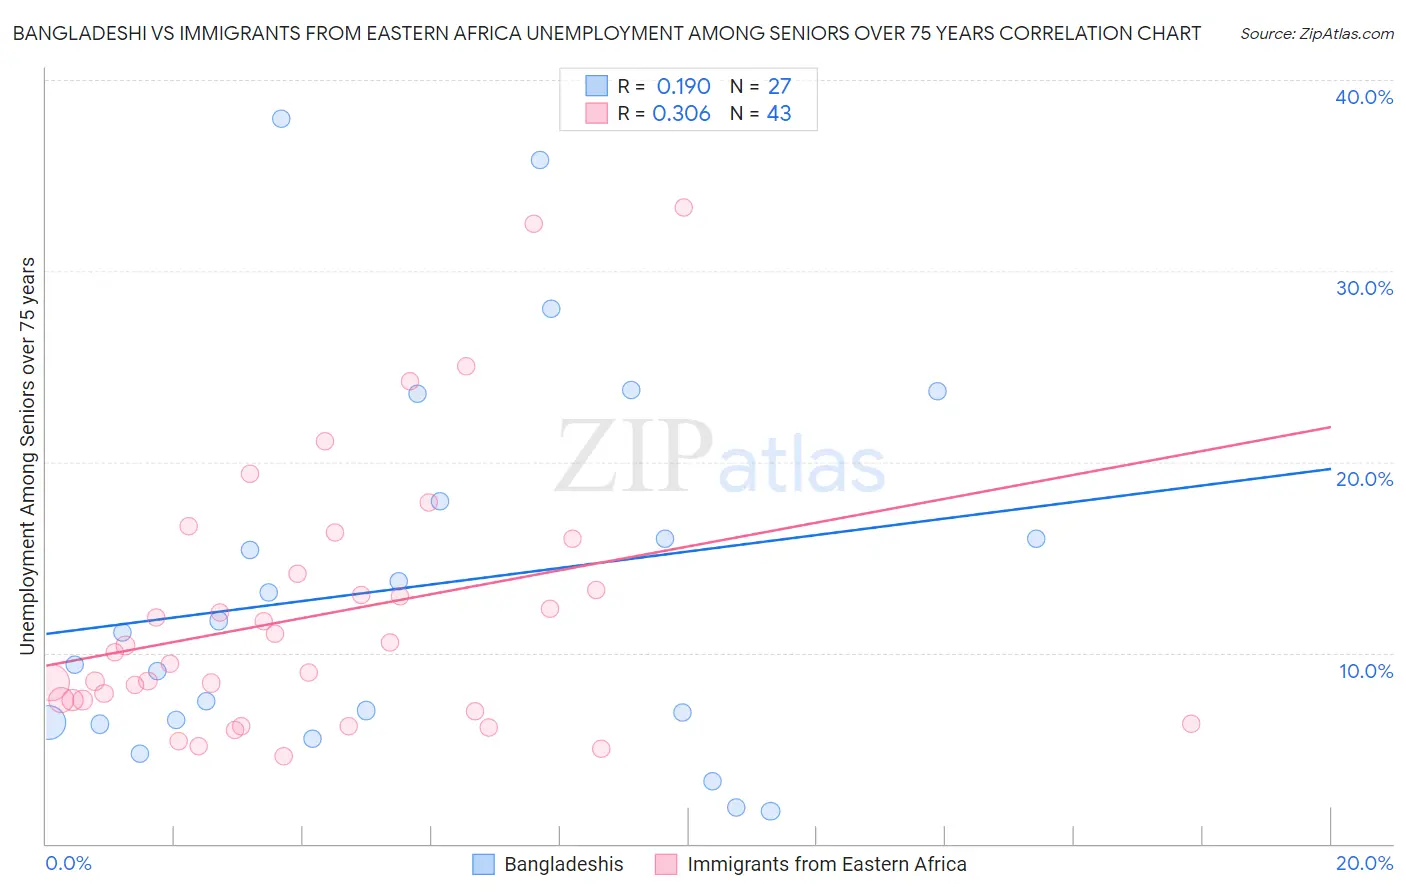
Bangladeshi vs Immigrants from Eastern Africa Unemployment Among Seniors over 75 years Correlation Chart
The statistical analysis conducted on geographies consisting of 94,162,163 people shows a poor positive correlation between the proportion of Bangladeshis and unemployment rate among seniors over the age of 75 in the United States with a correlation coefficient (R) of 0.190 and weighted average of 9.6%. Similarly, the statistical analysis conducted on geographies consisting of 189,663,738 people shows a mild positive correlation between the proportion of Immigrants from Eastern Africa and unemployment rate among seniors over the age of 75 in the United States with a correlation coefficient (R) of 0.306 and weighted average of 8.7%, a difference of 10.3%.
Unemployment Among Seniors over 75 years Correlation Summary
| Measurement | Bangladeshi | Immigrants from Eastern Africa |
| Minimum | 1.7% | 4.6% |
| Maximum | 38.0% | 33.3% |
| Range | 36.3% | 28.7% |
| Mean | 13.5% | 12.0% |
| Median | 11.1% | 10.0% |
| Interquartile 25% (IQ1) | 6.4% | 7.5% |
| Interquartile 75% (IQ3) | 18.0% | 14.1% |
| Interquartile Range (IQR) | 11.6% | 6.6% |
| Standard Deviation (Sample) | 9.8% | 6.9% |
| Standard Deviation (Population) | 9.6% | 6.8% |
Similar Demographics by Unemployment Among Seniors over 75 years
Demographics Similar to Bangladeshis by Unemployment Among Seniors over 75 years
In terms of unemployment among seniors over 75 years, the demographic groups most similar to Bangladeshis are Croatian (9.6%, a difference of 0.16%), British (9.6%, a difference of 0.30%), Macedonian (9.6%, a difference of 0.34%), Immigrants from Nigeria (9.6%, a difference of 0.38%), and Immigrants from Senegal (9.6%, a difference of 0.45%).
| Demographics | Rating | Rank | Unemployment Among Seniors over 75 years |
| Jamaicans | 0.2 /100 | #274 | Tragic 9.5% |
| Senegalese | 0.2 /100 | #275 | Tragic 9.5% |
| Arabs | 0.2 /100 | #276 | Tragic 9.5% |
| Swiss | 0.1 /100 | #277 | Tragic 9.5% |
| Immigrants | Senegal | 0.1 /100 | #278 | Tragic 9.6% |
| British | 0.1 /100 | #279 | Tragic 9.6% |
| Croatians | 0.1 /100 | #280 | Tragic 9.6% |
| Bangladeshis | 0.1 /100 | #281 | Tragic 9.6% |
| Macedonians | 0.0 /100 | #282 | Tragic 9.6% |
| Immigrants | Nigeria | 0.0 /100 | #283 | Tragic 9.6% |
| Europeans | 0.0 /100 | #284 | Tragic 9.7% |
| Carpatho Rusyns | 0.0 /100 | #285 | Tragic 9.7% |
| Nigerians | 0.0 /100 | #286 | Tragic 9.7% |
| Danes | 0.0 /100 | #287 | Tragic 9.7% |
| Canadians | 0.0 /100 | #288 | Tragic 9.7% |
Demographics Similar to Immigrants from Eastern Africa by Unemployment Among Seniors over 75 years
In terms of unemployment among seniors over 75 years, the demographic groups most similar to Immigrants from Eastern Africa are Immigrants from Belize (8.7%, a difference of 0.0%), Immigrants from Lithuania (8.7%, a difference of 0.020%), Fijian (8.7%, a difference of 0.060%), Zimbabwean (8.7%, a difference of 0.19%), and Immigrants from Dominican Republic (8.7%, a difference of 0.21%).
| Demographics | Rating | Rank | Unemployment Among Seniors over 75 years |
| Cree | 72.8 /100 | #160 | Good 8.6% |
| Albanians | 72.8 /100 | #161 | Good 8.6% |
| Immigrants | South America | 71.3 /100 | #162 | Good 8.6% |
| Immigrants | Guatemala | 68.4 /100 | #163 | Good 8.7% |
| Paraguayans | 62.2 /100 | #164 | Good 8.7% |
| Immigrants | Dominican Republic | 61.4 /100 | #165 | Good 8.7% |
| Immigrants | Belize | 57.6 /100 | #166 | Average 8.7% |
| Immigrants | Eastern Africa | 57.6 /100 | #167 | Average 8.7% |
| Immigrants | Lithuania | 57.2 /100 | #168 | Average 8.7% |
| Fijians | 56.4 /100 | #169 | Average 8.7% |
| Zimbabweans | 54.1 /100 | #170 | Average 8.7% |
| Dominicans | 51.9 /100 | #171 | Average 8.7% |
| Immigrants | Immigrants | 51.8 /100 | #172 | Average 8.7% |
| Australians | 50.3 /100 | #173 | Average 8.7% |
| Immigrants | El Salvador | 49.7 /100 | #174 | Average 8.7% |