Bahamian vs Malaysian Disability Age Over 75
COMPARE
Bahamian
Malaysian
Disability Age Over 75
Disability Age Over 75 Comparison
Bahamians
Malaysians
48.0%
DISABILITY AGE OVER 75
7.4/ 100
METRIC RATING
220th/ 347
METRIC RANK
49.0%
DISABILITY AGE OVER 75
0.2/ 100
METRIC RATING
267th/ 347
METRIC RANK
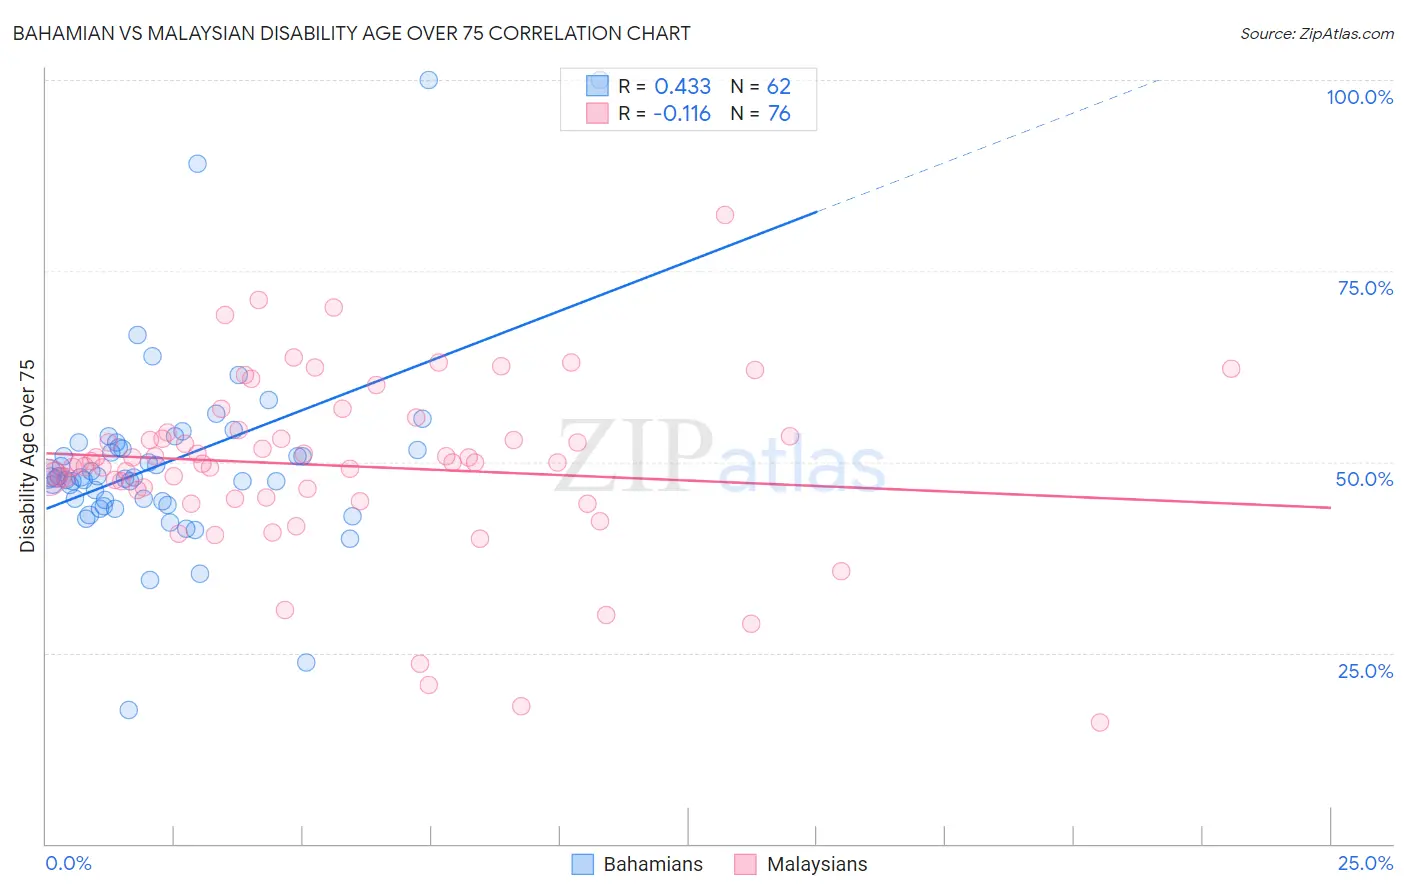
Bahamian vs Malaysian Disability Age Over 75 Correlation Chart
The statistical analysis conducted on geographies consisting of 112,565,508 people shows a moderate positive correlation between the proportion of Bahamians and percentage of population with a disability over the age of 75 in the United States with a correlation coefficient (R) of 0.433 and weighted average of 48.0%. Similarly, the statistical analysis conducted on geographies consisting of 225,778,475 people shows a poor negative correlation between the proportion of Malaysians and percentage of population with a disability over the age of 75 in the United States with a correlation coefficient (R) of -0.116 and weighted average of 49.0%, a difference of 2.1%.
Disability Age Over 75 Correlation Summary
| Measurement | Bahamian | Malaysian |
| Minimum | 17.5% | 15.9% |
| Maximum | 100.0% | 82.4% |
| Range | 82.5% | 66.5% |
| Mean | 50.0% | 49.5% |
| Median | 48.0% | 50.0% |
| Interquartile 25% (IQ1) | 44.9% | 45.8% |
| Interquartile 75% (IQ3) | 51.8% | 53.6% |
| Interquartile Range (IQR) | 6.9% | 7.8% |
| Standard Deviation (Sample) | 13.0% | 11.5% |
| Standard Deviation (Population) | 12.9% | 11.4% |
Similar Demographics by Disability Age Over 75
Demographics Similar to Bahamians by Disability Age Over 75
In terms of disability age over 75, the demographic groups most similar to Bahamians are Immigrants from Western Asia (48.0%, a difference of 0.010%), Immigrants from Oceania (48.0%, a difference of 0.010%), Barbadian (48.0%, a difference of 0.050%), Immigrants from Bangladesh (48.0%, a difference of 0.050%), and Liberian (48.0%, a difference of 0.060%).
| Demographics | Rating | Rank | Disability Age Over 75 |
| Laotians | 11.5 /100 | #213 | Poor 47.9% |
| Immigrants | Barbados | 10.7 /100 | #214 | Poor 47.9% |
| Senegalese | 10.7 /100 | #215 | Poor 47.9% |
| Immigrants | Panama | 10.2 /100 | #216 | Poor 47.9% |
| Immigrants | Grenada | 9.4 /100 | #217 | Tragic 47.9% |
| Immigrants | Western Africa | 8.3 /100 | #218 | Tragic 48.0% |
| Immigrants | Western Asia | 7.5 /100 | #219 | Tragic 48.0% |
| Bahamians | 7.4 /100 | #220 | Tragic 48.0% |
| Immigrants | Oceania | 7.3 /100 | #221 | Tragic 48.0% |
| Barbadians | 6.8 /100 | #222 | Tragic 48.0% |
| Immigrants | Bangladesh | 6.8 /100 | #223 | Tragic 48.0% |
| Liberians | 6.7 /100 | #224 | Tragic 48.0% |
| Spanish | 6.5 /100 | #225 | Tragic 48.0% |
| Immigrants | Nonimmigrants | 6.5 /100 | #226 | Tragic 48.0% |
| Zimbabweans | 6.4 /100 | #227 | Tragic 48.1% |
Demographics Similar to Malaysians by Disability Age Over 75
In terms of disability age over 75, the demographic groups most similar to Malaysians are Guatemalan (49.0%, a difference of 0.020%), Immigrants from El Salvador (49.0%, a difference of 0.040%), Potawatomi (49.0%, a difference of 0.060%), Fijian (49.0%, a difference of 0.080%), and Assyrian/Chaldean/Syriac (49.1%, a difference of 0.090%).
| Demographics | Rating | Rank | Disability Age Over 75 |
| Immigrants | Afghanistan | 0.4 /100 | #260 | Tragic 48.8% |
| Africans | 0.3 /100 | #261 | Tragic 48.9% |
| Immigrants | West Indies | 0.3 /100 | #262 | Tragic 48.9% |
| Salvadorans | 0.3 /100 | #263 | Tragic 48.9% |
| Immigrants | Honduras | 0.3 /100 | #264 | Tragic 48.9% |
| Hondurans | 0.3 /100 | #265 | Tragic 48.9% |
| U.S. Virgin Islanders | 0.2 /100 | #266 | Tragic 48.9% |
| Malaysians | 0.2 /100 | #267 | Tragic 49.0% |
| Guatemalans | 0.2 /100 | #268 | Tragic 49.0% |
| Immigrants | El Salvador | 0.2 /100 | #269 | Tragic 49.0% |
| Potawatomi | 0.2 /100 | #270 | Tragic 49.0% |
| Fijians | 0.2 /100 | #271 | Tragic 49.0% |
| Assyrians/Chaldeans/Syriacs | 0.2 /100 | #272 | Tragic 49.1% |
| Immigrants | Iraq | 0.1 /100 | #273 | Tragic 49.1% |
| Immigrants | Guatemala | 0.1 /100 | #274 | Tragic 49.1% |