Armenian vs Dominican Divorced or Separated
COMPARE
Armenian
Dominican
Divorced or Separated
Divorced or Separated Comparison
Armenians
Dominicans
11.0%
DIVORCED OR SEPARATED
100.0/ 100
METRIC RATING
29th/ 347
METRIC RANK
12.7%
DIVORCED OR SEPARATED
0.2/ 100
METRIC RATING
277th/ 347
METRIC RANK
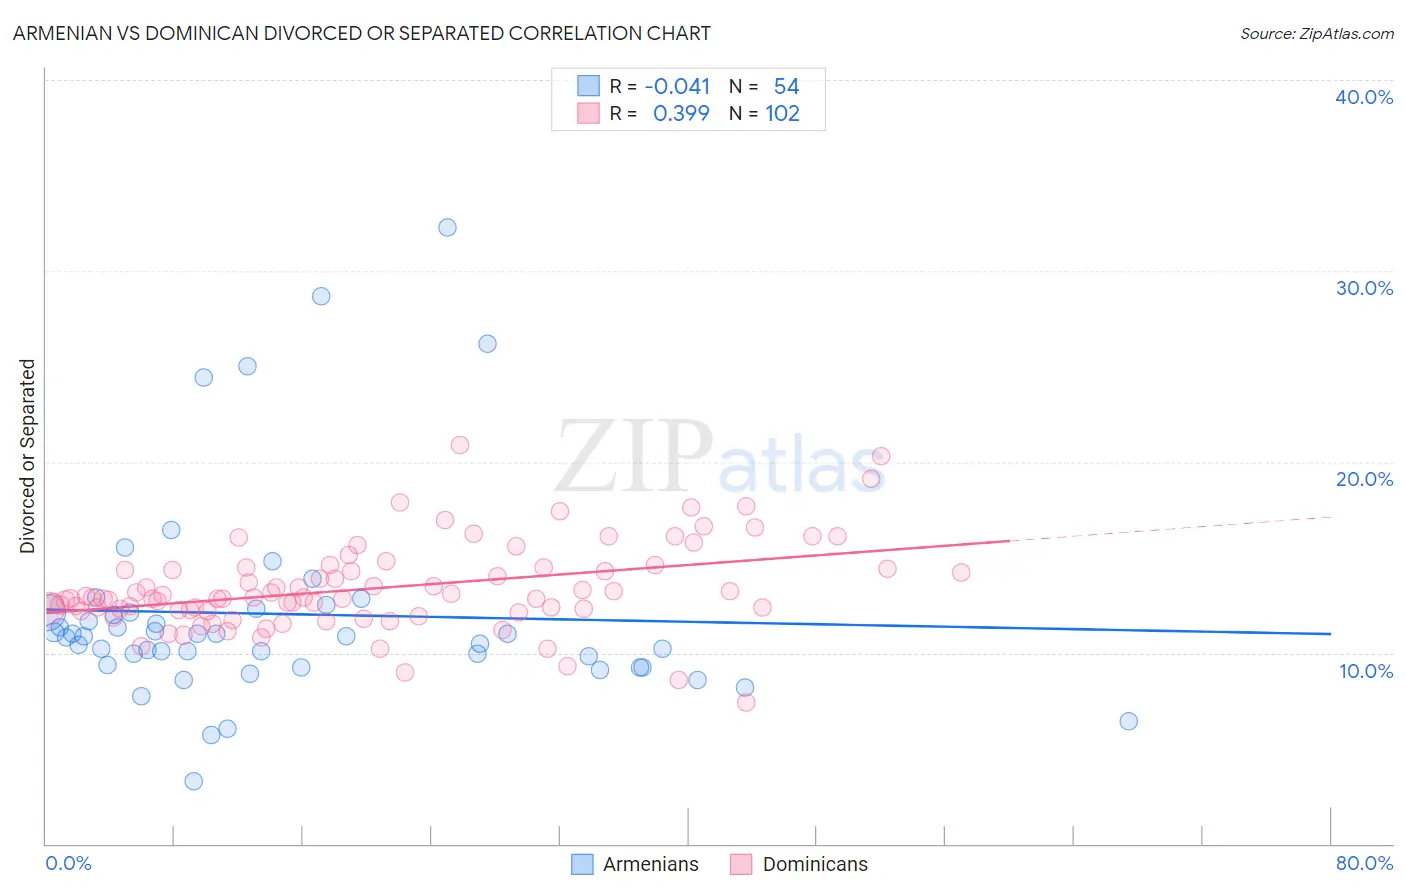
Armenian vs Dominican Divorced or Separated Correlation Chart
The statistical analysis conducted on geographies consisting of 310,841,863 people shows no correlation between the proportion of Armenians and percentage of population currently divorced or separated in the United States with a correlation coefficient (R) of -0.041 and weighted average of 11.0%. Similarly, the statistical analysis conducted on geographies consisting of 354,903,944 people shows a mild positive correlation between the proportion of Dominicans and percentage of population currently divorced or separated in the United States with a correlation coefficient (R) of 0.399 and weighted average of 12.7%, a difference of 15.6%.
Divorced or Separated Correlation Summary
| Measurement | Armenian | Dominican |
| Minimum | 3.3% | 7.4% |
| Maximum | 32.3% | 20.9% |
| Range | 29.0% | 13.5% |
| Mean | 12.0% | 13.4% |
| Median | 10.9% | 12.9% |
| Interquartile 25% (IQ1) | 9.4% | 12.2% |
| Interquartile 75% (IQ3) | 12.1% | 14.4% |
| Interquartile Range (IQR) | 2.7% | 2.2% |
| Standard Deviation (Sample) | 5.5% | 2.3% |
| Standard Deviation (Population) | 5.4% | 2.3% |
Similar Demographics by Divorced or Separated
Demographics Similar to Armenians by Divorced or Separated
In terms of divorced or separated, the demographic groups most similar to Armenians are Immigrants from Malaysia (11.0%, a difference of 0.070%), Immigrants from Bangladesh (11.0%, a difference of 0.10%), Immigrants from Ireland (11.0%, a difference of 0.52%), Immigrants from Indonesia (10.9%, a difference of 0.54%), and Mongolian (11.1%, a difference of 0.82%).
| Demographics | Rating | Rank | Divorced or Separated |
| Vietnamese | 100.0 /100 | #22 | Exceptional 10.8% |
| Immigrants | Pakistan | 100.0 /100 | #23 | Exceptional 10.8% |
| Immigrants | Sri Lanka | 100.0 /100 | #24 | Exceptional 10.8% |
| Iranians | 100.0 /100 | #25 | Exceptional 10.8% |
| Immigrants | Indonesia | 100.0 /100 | #26 | Exceptional 10.9% |
| Immigrants | Bangladesh | 100.0 /100 | #27 | Exceptional 11.0% |
| Immigrants | Malaysia | 100.0 /100 | #28 | Exceptional 11.0% |
| Armenians | 100.0 /100 | #29 | Exceptional 11.0% |
| Immigrants | Ireland | 100.0 /100 | #30 | Exceptional 11.0% |
| Mongolians | 100.0 /100 | #31 | Exceptional 11.1% |
| Tongans | 100.0 /100 | #32 | Exceptional 11.1% |
| Egyptians | 100.0 /100 | #33 | Exceptional 11.1% |
| Immigrants | Uzbekistan | 100.0 /100 | #34 | Exceptional 11.1% |
| Cambodians | 100.0 /100 | #35 | Exceptional 11.1% |
| Immigrants | Japan | 100.0 /100 | #36 | Exceptional 11.1% |
Demographics Similar to Dominicans by Divorced or Separated
In terms of divorced or separated, the demographic groups most similar to Dominicans are Spaniard (12.7%, a difference of 0.050%), Central American Indian (12.7%, a difference of 0.11%), Bermudan (12.7%, a difference of 0.14%), Immigrants from Micronesia (12.7%, a difference of 0.15%), and Lumbee (12.7%, a difference of 0.16%).
| Demographics | Rating | Rank | Divorced or Separated |
| Ute | 0.4 /100 | #270 | Tragic 12.6% |
| Panamanians | 0.3 /100 | #271 | Tragic 12.7% |
| Immigrants | Middle Africa | 0.3 /100 | #272 | Tragic 12.7% |
| Immigrants | Micronesia | 0.3 /100 | #273 | Tragic 12.7% |
| Bermudans | 0.3 /100 | #274 | Tragic 12.7% |
| Central American Indians | 0.3 /100 | #275 | Tragic 12.7% |
| Spaniards | 0.2 /100 | #276 | Tragic 12.7% |
| Dominicans | 0.2 /100 | #277 | Tragic 12.7% |
| Lumbee | 0.2 /100 | #278 | Tragic 12.7% |
| Immigrants | Dominican Republic | 0.2 /100 | #279 | Tragic 12.7% |
| Immigrants | Zaire | 0.2 /100 | #280 | Tragic 12.7% |
| Pueblo | 0.2 /100 | #281 | Tragic 12.7% |
| Sub-Saharan Africans | 0.1 /100 | #282 | Tragic 12.7% |
| Delaware | 0.1 /100 | #283 | Tragic 12.7% |
| Immigrants | Nonimmigrants | 0.1 /100 | #284 | Tragic 12.8% |