American vs Dominican Divorced or Separated
COMPARE
American
Dominican
Divorced or Separated
Divorced or Separated Comparison
Americans
Dominicans
13.2%
DIVORCED OR SEPARATED
0.0/ 100
METRIC RATING
309th/ 347
METRIC RANK
12.7%
DIVORCED OR SEPARATED
0.2/ 100
METRIC RATING
277th/ 347
METRIC RANK
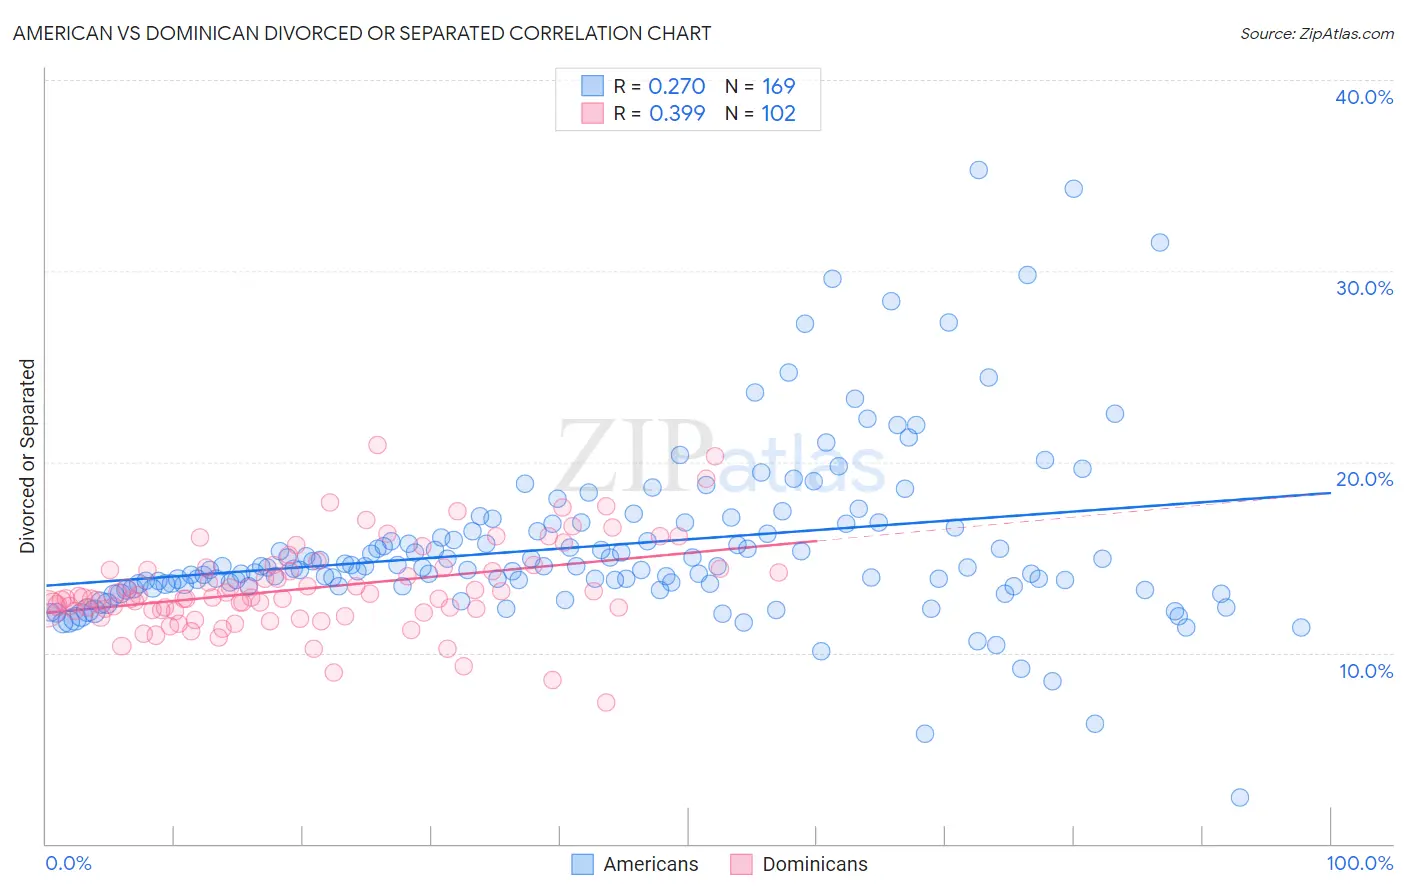
American vs Dominican Divorced or Separated Correlation Chart
The statistical analysis conducted on geographies consisting of 581,440,230 people shows a weak positive correlation between the proportion of Americans and percentage of population currently divorced or separated in the United States with a correlation coefficient (R) of 0.270 and weighted average of 13.2%. Similarly, the statistical analysis conducted on geographies consisting of 354,903,944 people shows a mild positive correlation between the proportion of Dominicans and percentage of population currently divorced or separated in the United States with a correlation coefficient (R) of 0.399 and weighted average of 12.7%, a difference of 4.3%.
Divorced or Separated Correlation Summary
| Measurement | American | Dominican |
| Minimum | 2.4% | 7.4% |
| Maximum | 35.3% | 20.9% |
| Range | 32.9% | 13.5% |
| Mean | 15.6% | 13.4% |
| Median | 14.5% | 12.9% |
| Interquartile 25% (IQ1) | 13.5% | 12.2% |
| Interquartile 75% (IQ3) | 16.6% | 14.4% |
| Interquartile Range (IQR) | 3.1% | 2.2% |
| Standard Deviation (Sample) | 4.6% | 2.3% |
| Standard Deviation (Population) | 4.6% | 2.3% |
Similar Demographics by Divorced or Separated
Demographics Similar to Americans by Divorced or Separated
In terms of divorced or separated, the demographic groups most similar to Americans are Ottawa (13.2%, a difference of 0.010%), African (13.2%, a difference of 0.020%), Sioux (13.2%, a difference of 0.040%), French American Indian (13.2%, a difference of 0.10%), and Tlingit-Haida (13.2%, a difference of 0.35%).
| Demographics | Rating | Rank | Divorced or Separated |
| Immigrants | Venezuela | 0.0 /100 | #302 | Tragic 13.1% |
| Cape Verdeans | 0.0 /100 | #303 | Tragic 13.1% |
| Hopi | 0.0 /100 | #304 | Tragic 13.2% |
| Chippewa | 0.0 /100 | #305 | Tragic 13.2% |
| Tlingit-Haida | 0.0 /100 | #306 | Tragic 13.2% |
| French American Indians | 0.0 /100 | #307 | Tragic 13.2% |
| Ottawa | 0.0 /100 | #308 | Tragic 13.2% |
| Americans | 0.0 /100 | #309 | Tragic 13.2% |
| Africans | 0.0 /100 | #310 | Tragic 13.2% |
| Sioux | 0.0 /100 | #311 | Tragic 13.2% |
| Blackfeet | 0.0 /100 | #312 | Tragic 13.3% |
| Immigrants | Nicaragua | 0.0 /100 | #313 | Tragic 13.3% |
| Yaqui | 0.0 /100 | #314 | Tragic 13.3% |
| Spanish Americans | 0.0 /100 | #315 | Tragic 13.3% |
| Tsimshian | 0.0 /100 | #316 | Tragic 13.3% |
Demographics Similar to Dominicans by Divorced or Separated
In terms of divorced or separated, the demographic groups most similar to Dominicans are Spaniard (12.7%, a difference of 0.050%), Central American Indian (12.7%, a difference of 0.11%), Bermudan (12.7%, a difference of 0.14%), Immigrants from Micronesia (12.7%, a difference of 0.15%), and Lumbee (12.7%, a difference of 0.16%).
| Demographics | Rating | Rank | Divorced or Separated |
| Ute | 0.4 /100 | #270 | Tragic 12.6% |
| Panamanians | 0.3 /100 | #271 | Tragic 12.7% |
| Immigrants | Middle Africa | 0.3 /100 | #272 | Tragic 12.7% |
| Immigrants | Micronesia | 0.3 /100 | #273 | Tragic 12.7% |
| Bermudans | 0.3 /100 | #274 | Tragic 12.7% |
| Central American Indians | 0.3 /100 | #275 | Tragic 12.7% |
| Spaniards | 0.2 /100 | #276 | Tragic 12.7% |
| Dominicans | 0.2 /100 | #277 | Tragic 12.7% |
| Lumbee | 0.2 /100 | #278 | Tragic 12.7% |
| Immigrants | Dominican Republic | 0.2 /100 | #279 | Tragic 12.7% |
| Immigrants | Zaire | 0.2 /100 | #280 | Tragic 12.7% |
| Pueblo | 0.2 /100 | #281 | Tragic 12.7% |
| Sub-Saharan Africans | 0.1 /100 | #282 | Tragic 12.7% |
| Delaware | 0.1 /100 | #283 | Tragic 12.7% |
| Immigrants | Nonimmigrants | 0.1 /100 | #284 | Tragic 12.8% |