Immigrants from Cabo Verde vs Colombian Average Family Size
COMPARE
Immigrants from Cabo Verde
Colombian
Average Family Size
Average Family Size Comparison
Immigrants from Cabo Verde
Colombians
3.20
AVERAGE FAMILY SIZE
16.0/ 100
METRIC RATING
206th/ 347
METRIC RANK
3.26
AVERAGE FAMILY SIZE
89.9/ 100
METRIC RATING
128th/ 347
METRIC RANK
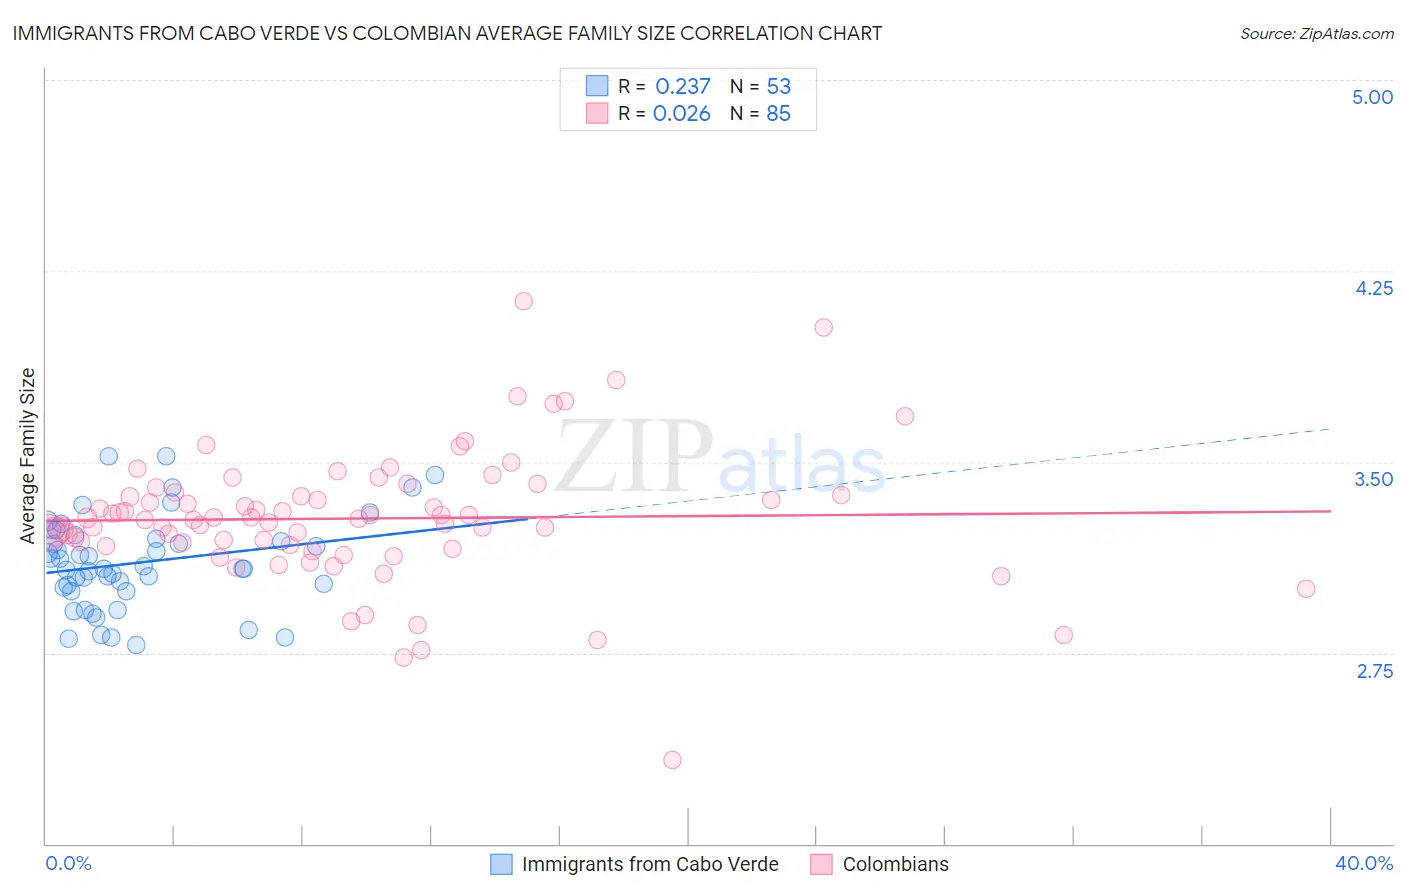
Immigrants from Cabo Verde vs Colombian Average Family Size Correlation Chart
The statistical analysis conducted on geographies consisting of 38,135,369 people shows a weak positive correlation between the proportion of Immigrants from Cabo Verde and average family size in the United States with a correlation coefficient (R) of 0.237 and weighted average of 3.20. Similarly, the statistical analysis conducted on geographies consisting of 419,324,295 people shows no correlation between the proportion of Colombians and average family size in the United States with a correlation coefficient (R) of 0.026 and weighted average of 3.26, a difference of 1.8%.
Average Family Size Correlation Summary
| Measurement | Immigrants from Cabo Verde | Colombian |
| Minimum | 2.78 | 2.33 |
| Maximum | 3.52 | 4.13 |
| Range | 0.74 | 1.80 |
| Mean | 3.10 | 3.28 |
| Median | 3.08 | 3.28 |
| Interquartile 25% (IQ1) | 3.00 | 3.17 |
| Interquartile 75% (IQ3) | 3.21 | 3.37 |
| Interquartile Range (IQR) | 0.21 | 0.20 |
| Standard Deviation (Sample) | 0.18 | 0.26 |
| Standard Deviation (Population) | 0.18 | 0.26 |
Similar Demographics by Average Family Size
Demographics Similar to Immigrants from Cabo Verde by Average Family Size
In terms of average family size, the demographic groups most similar to Immigrants from Cabo Verde are Paraguayan (3.20, a difference of 0.010%), Immigrants from Poland (3.20, a difference of 0.020%), Immigrants from Nepal (3.21, a difference of 0.070%), Immigrants from Morocco (3.21, a difference of 0.080%), and Immigrants from India (3.21, a difference of 0.080%).
| Demographics | Rating | Rank | Average Family Size |
| Hmong | 20.7 /100 | #199 | Fair 3.21 |
| Immigrants | Kenya | 19.2 /100 | #200 | Poor 3.21 |
| Immigrants | Morocco | 18.5 /100 | #201 | Poor 3.21 |
| Immigrants | India | 18.5 /100 | #202 | Poor 3.21 |
| Immigrants | Nepal | 18.1 /100 | #203 | Poor 3.21 |
| Immigrants | Poland | 16.6 /100 | #204 | Poor 3.20 |
| Paraguayans | 16.3 /100 | #205 | Poor 3.20 |
| Immigrants | Cabo Verde | 16.0 /100 | #206 | Poor 3.20 |
| Filipinos | 13.6 /100 | #207 | Poor 3.20 |
| Chippewa | 13.3 /100 | #208 | Poor 3.20 |
| Sudanese | 13.3 /100 | #209 | Poor 3.20 |
| Zimbabweans | 12.6 /100 | #210 | Poor 3.20 |
| Immigrants | Iran | 12.1 /100 | #211 | Poor 3.20 |
| Creek | 12.1 /100 | #212 | Poor 3.20 |
| Mongolians | 11.5 /100 | #213 | Poor 3.20 |
Demographics Similar to Colombians by Average Family Size
In terms of average family size, the demographic groups most similar to Colombians are Immigrants from Costa Rica (3.26, a difference of 0.040%), Immigrants from Syria (3.26, a difference of 0.040%), Immigrants from Hong Kong (3.26, a difference of 0.060%), Laotian (3.26, a difference of 0.060%), and Immigrants from Cuba (3.26, a difference of 0.080%).
| Demographics | Rating | Rank | Average Family Size |
| Immigrants | Thailand | 93.3 /100 | #121 | Exceptional 3.27 |
| Immigrants | Colombia | 92.8 /100 | #122 | Exceptional 3.27 |
| Alaskan Athabascans | 92.4 /100 | #123 | Exceptional 3.27 |
| South American Indians | 91.6 /100 | #124 | Exceptional 3.26 |
| Immigrants | Cuba | 91.3 /100 | #125 | Exceptional 3.26 |
| Immigrants | Costa Rica | 90.7 /100 | #126 | Exceptional 3.26 |
| Immigrants | Syria | 90.6 /100 | #127 | Exceptional 3.26 |
| Colombians | 89.9 /100 | #128 | Excellent 3.26 |
| Immigrants | Hong Kong | 88.6 /100 | #129 | Excellent 3.26 |
| Laotians | 88.5 /100 | #130 | Excellent 3.26 |
| Immigrants | Western Asia | 87.7 /100 | #131 | Excellent 3.26 |
| Costa Ricans | 86.8 /100 | #132 | Excellent 3.26 |
| Immigrants | Venezuela | 86.3 /100 | #133 | Excellent 3.26 |
| Africans | 84.9 /100 | #134 | Excellent 3.25 |
| Panamanians | 84.2 /100 | #135 | Excellent 3.25 |