Alaskan Athabascan vs Immigrants from South America Family Households with Children
COMPARE
Alaskan Athabascan
Immigrants from South America
Family Households with Children
Family Households with Children Comparison
Alaskan Athabascans
Immigrants from South America
27.6%
FAMILY HOUSEHOLDS WITH CHILDREN
67.1/ 100
METRIC RATING
161st/ 347
METRIC RANK
28.0%
FAMILY HOUSEHOLDS WITH CHILDREN
98.0/ 100
METRIC RATING
106th/ 347
METRIC RANK
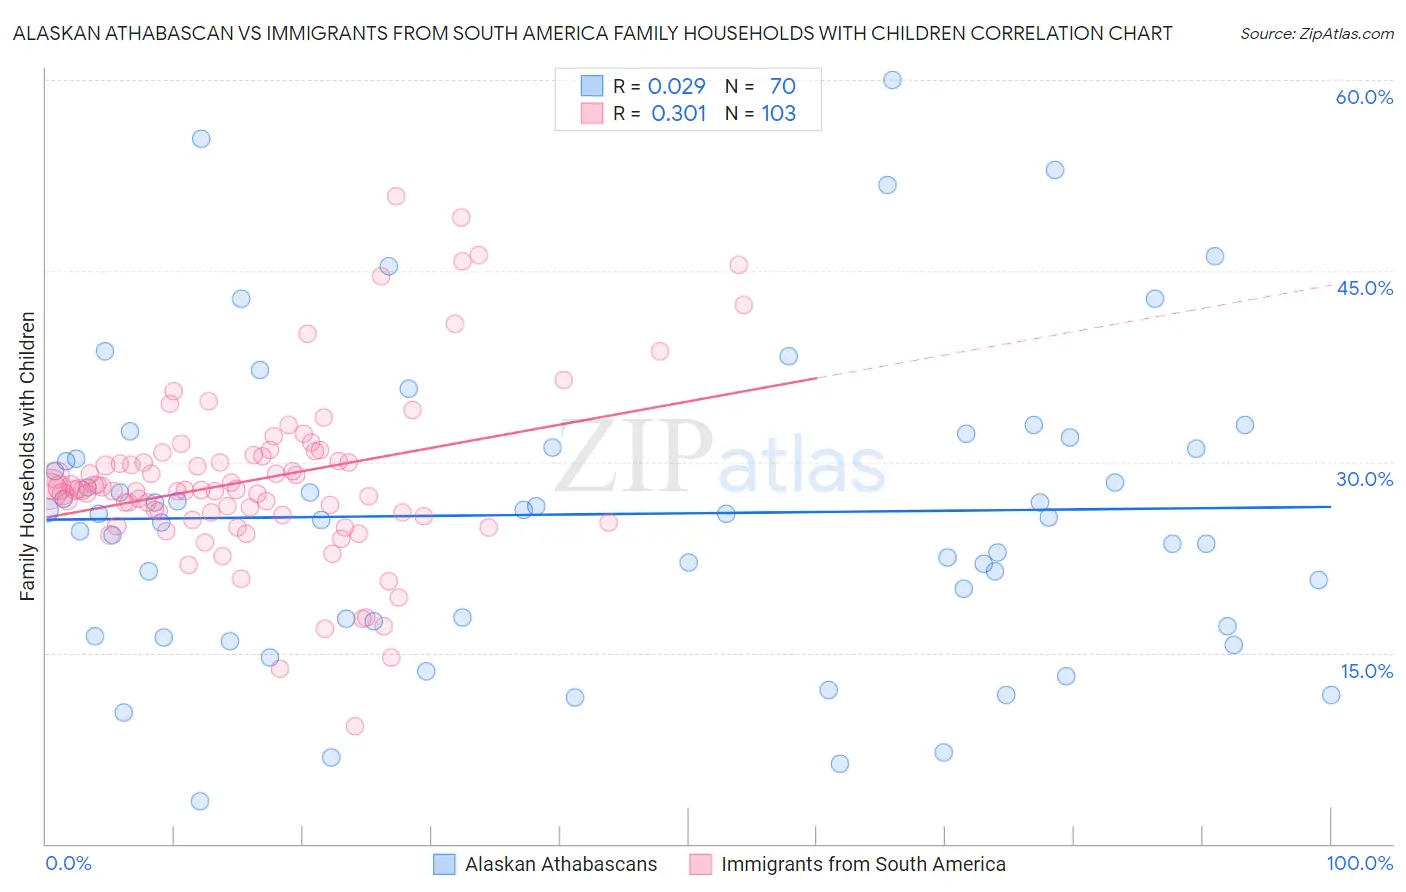
Alaskan Athabascan vs Immigrants from South America Family Households with Children Correlation Chart
The statistical analysis conducted on geographies consisting of 45,814,006 people shows no correlation between the proportion of Alaskan Athabascans and percentage of family households with children in the United States with a correlation coefficient (R) of 0.029 and weighted average of 27.6%. Similarly, the statistical analysis conducted on geographies consisting of 485,768,775 people shows a mild positive correlation between the proportion of Immigrants from South America and percentage of family households with children in the United States with a correlation coefficient (R) of 0.301 and weighted average of 28.0%, a difference of 1.7%.
Family Households with Children Correlation Summary
| Measurement | Alaskan Athabascan | Immigrants from South America |
| Minimum | 3.3% | 9.2% |
| Maximum | 60.0% | 50.9% |
| Range | 56.7% | 41.7% |
| Mean | 25.9% | 28.6% |
| Median | 25.8% | 27.8% |
| Interquartile 25% (IQ1) | 17.5% | 25.8% |
| Interquartile 75% (IQ3) | 31.1% | 30.5% |
| Interquartile Range (IQR) | 13.6% | 4.8% |
| Standard Deviation (Sample) | 11.8% | 6.9% |
| Standard Deviation (Population) | 11.7% | 6.9% |
Similar Demographics by Family Households with Children
Demographics Similar to Alaskan Athabascans by Family Households with Children
In terms of family households with children, the demographic groups most similar to Alaskan Athabascans are Immigrants from Bangladesh (27.6%, a difference of 0.0%), Subsaharan African (27.6%, a difference of 0.010%), Czech (27.5%, a difference of 0.040%), Immigrants from Hong Kong (27.5%, a difference of 0.050%), and Romanian (27.6%, a difference of 0.090%).
| Demographics | Rating | Rank | Family Households with Children |
| Icelanders | 75.3 /100 | #154 | Good 27.6% |
| Comanche | 74.8 /100 | #155 | Good 27.6% |
| Hungarians | 74.6 /100 | #156 | Good 27.6% |
| Indians (Asian) | 71.6 /100 | #157 | Good 27.6% |
| Romanians | 70.8 /100 | #158 | Good 27.6% |
| Mongolians | 70.7 /100 | #159 | Good 27.6% |
| Sub-Saharan Africans | 67.5 /100 | #160 | Good 27.6% |
| Alaskan Athabascans | 67.1 /100 | #161 | Good 27.6% |
| Immigrants | Bangladesh | 67.0 /100 | #162 | Good 27.6% |
| Czechs | 65.3 /100 | #163 | Good 27.5% |
| Immigrants | Hong Kong | 64.9 /100 | #164 | Good 27.5% |
| Immigrants | South Africa | 61.3 /100 | #165 | Good 27.5% |
| Immigrants | Nonimmigrants | 61.2 /100 | #166 | Good 27.5% |
| Dominicans | 61.1 /100 | #167 | Good 27.5% |
| Immigrants | Kuwait | 60.9 /100 | #168 | Good 27.5% |
Demographics Similar to Immigrants from South America by Family Households with Children
In terms of family households with children, the demographic groups most similar to Immigrants from South America are Immigrants from Uganda (28.0%, a difference of 0.060%), Immigrants from Burma/Myanmar (28.0%, a difference of 0.080%), Tohono O'odham (28.0%, a difference of 0.090%), Choctaw (28.1%, a difference of 0.10%), and Sioux (28.1%, a difference of 0.11%).
| Demographics | Rating | Rank | Family Households with Children |
| Immigrants | Azores | 98.8 /100 | #99 | Exceptional 28.1% |
| Indonesians | 98.8 /100 | #100 | Exceptional 28.1% |
| Immigrants | Oceania | 98.8 /100 | #101 | Exceptional 28.1% |
| Assyrians/Chaldeans/Syriacs | 98.7 /100 | #102 | Exceptional 28.1% |
| Palestinians | 98.5 /100 | #103 | Exceptional 28.1% |
| Sioux | 98.3 /100 | #104 | Exceptional 28.1% |
| Choctaw | 98.3 /100 | #105 | Exceptional 28.1% |
| Immigrants | South America | 98.0 /100 | #106 | Exceptional 28.0% |
| Immigrants | Uganda | 97.7 /100 | #107 | Exceptional 28.0% |
| Immigrants | Burma/Myanmar | 97.7 /100 | #108 | Exceptional 28.0% |
| Tohono O'odham | 97.6 /100 | #109 | Exceptional 28.0% |
| Spaniards | 97.4 /100 | #110 | Exceptional 28.0% |
| Scandinavians | 97.1 /100 | #111 | Exceptional 28.0% |
| Immigrants | Middle Africa | 97.0 /100 | #112 | Exceptional 28.0% |
| Arabs | 97.0 /100 | #113 | Exceptional 28.0% |