African vs Immigrants from Moldova Family Households with Children
COMPARE
African
Immigrants from Moldova
Family Households with Children
Family Households with Children Comparison
Africans
Immigrants from Moldova
27.2%
FAMILY HOUSEHOLDS WITH CHILDREN
13.0/ 100
METRIC RATING
214th/ 347
METRIC RANK
27.6%
FAMILY HOUSEHOLDS WITH CHILDREN
79.1/ 100
METRIC RATING
147th/ 347
METRIC RANK
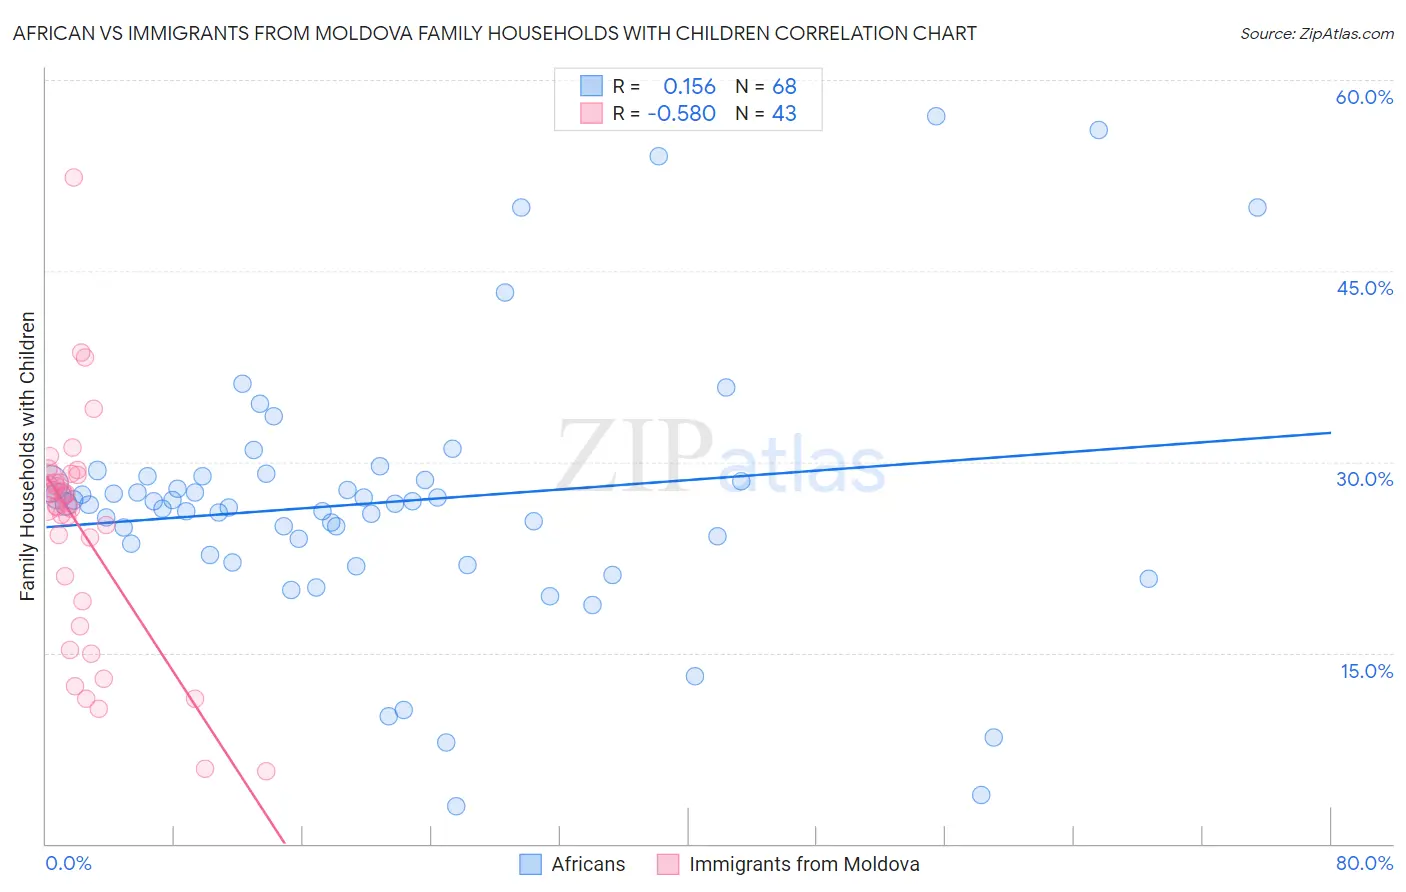
African vs Immigrants from Moldova Family Households with Children Correlation Chart
The statistical analysis conducted on geographies consisting of 469,417,507 people shows a poor positive correlation between the proportion of Africans and percentage of family households with children in the United States with a correlation coefficient (R) of 0.156 and weighted average of 27.2%. Similarly, the statistical analysis conducted on geographies consisting of 124,355,422 people shows a substantial negative correlation between the proportion of Immigrants from Moldova and percentage of family households with children in the United States with a correlation coefficient (R) of -0.580 and weighted average of 27.6%, a difference of 1.8%.
Family Households with Children Correlation Summary
| Measurement | African | Immigrants from Moldova |
| Minimum | 3.0% | 5.6% |
| Maximum | 57.1% | 52.3% |
| Range | 54.2% | 46.7% |
| Mean | 26.8% | 24.7% |
| Median | 26.7% | 26.6% |
| Interquartile 25% (IQ1) | 23.1% | 19.1% |
| Interquartile 75% (IQ3) | 28.7% | 29.0% |
| Interquartile Range (IQR) | 5.6% | 9.9% |
| Standard Deviation (Sample) | 10.3% | 9.0% |
| Standard Deviation (Population) | 10.3% | 8.9% |
Similar Demographics by Family Households with Children
Demographics Similar to Africans by Family Households with Children
In terms of family households with children, the demographic groups most similar to Africans are Northern European (27.2%, a difference of 0.010%), Immigrants from Dominica (27.2%, a difference of 0.040%), Okinawan (27.2%, a difference of 0.040%), Cuban (27.1%, a difference of 0.040%), and U.S. Virgin Islander (27.1%, a difference of 0.040%).
| Demographics | Rating | Rank | Family Households with Children |
| Haitians | 19.8 /100 | #207 | Poor 27.2% |
| Immigrants | Poland | 16.4 /100 | #208 | Poor 27.2% |
| Dutch West Indians | 15.8 /100 | #209 | Poor 27.2% |
| Immigrants | Ukraine | 14.4 /100 | #210 | Poor 27.2% |
| Welsh | 14.2 /100 | #211 | Poor 27.2% |
| Immigrants | Dominica | 13.9 /100 | #212 | Poor 27.2% |
| Okinawans | 13.7 /100 | #213 | Poor 27.2% |
| Africans | 13.0 /100 | #214 | Poor 27.2% |
| Northern Europeans | 12.8 /100 | #215 | Poor 27.2% |
| Cubans | 12.2 /100 | #216 | Poor 27.1% |
| U.S. Virgin Islanders | 12.1 /100 | #217 | Poor 27.1% |
| Greeks | 11.4 /100 | #218 | Poor 27.1% |
| Immigrants | Japan | 10.7 /100 | #219 | Poor 27.1% |
| Austrians | 9.9 /100 | #220 | Tragic 27.1% |
| New Zealanders | 9.6 /100 | #221 | Tragic 27.1% |
Demographics Similar to Immigrants from Moldova by Family Households with Children
In terms of family households with children, the demographic groups most similar to Immigrants from Moldova are Osage (27.6%, a difference of 0.0%), Immigrants from Chile (27.7%, a difference of 0.010%), Basque (27.7%, a difference of 0.010%), Menominee (27.6%, a difference of 0.010%), and Brazilian (27.7%, a difference of 0.020%).
| Demographics | Rating | Rank | Family Households with Children |
| Spanish | 81.8 /100 | #140 | Excellent 27.7% |
| Immigrants | Eastern Asia | 81.7 /100 | #141 | Excellent 27.7% |
| Swiss | 81.4 /100 | #142 | Excellent 27.7% |
| Immigrants | Eastern Africa | 80.2 /100 | #143 | Excellent 27.7% |
| Brazilians | 79.6 /100 | #144 | Good 27.7% |
| Immigrants | Chile | 79.5 /100 | #145 | Good 27.7% |
| Basques | 79.5 /100 | #146 | Good 27.7% |
| Immigrants | Moldova | 79.1 /100 | #147 | Good 27.6% |
| Osage | 79.0 /100 | #148 | Good 27.6% |
| Menominee | 78.9 /100 | #149 | Good 27.6% |
| Argentineans | 78.5 /100 | #150 | Good 27.6% |
| Portuguese | 77.8 /100 | #151 | Good 27.6% |
| Ethiopians | 77.0 /100 | #152 | Good 27.6% |
| Immigrants | Cabo Verde | 75.6 /100 | #153 | Good 27.6% |
| Icelanders | 75.3 /100 | #154 | Good 27.6% |