Immigrants from Bosnia and Herzegovina vs Immigrants from Moldova Family Households with Children
COMPARE
Immigrants from Bosnia and Herzegovina
Immigrants from Moldova
Family Households with Children
Family Households with Children Comparison
Immigrants from Bosnia and Herzegovina
Immigrants from Moldova
26.8%
FAMILY HOUSEHOLDS WITH CHILDREN
1.9/ 100
METRIC RATING
251st/ 347
METRIC RANK
27.6%
FAMILY HOUSEHOLDS WITH CHILDREN
79.1/ 100
METRIC RATING
147th/ 347
METRIC RANK
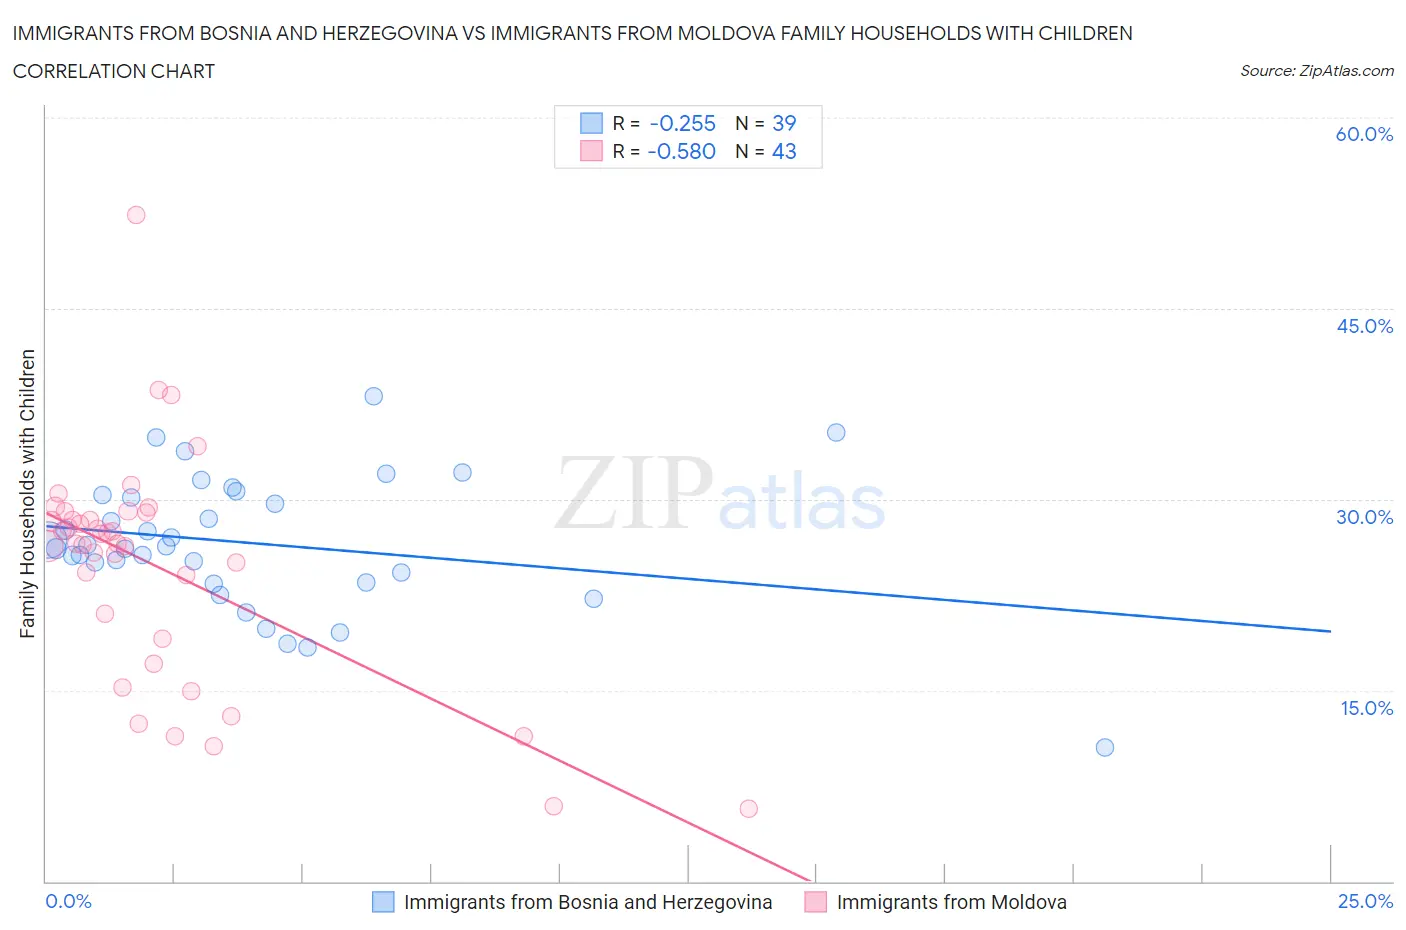
Immigrants from Bosnia and Herzegovina vs Immigrants from Moldova Family Households with Children Correlation Chart
The statistical analysis conducted on geographies consisting of 156,805,272 people shows a weak negative correlation between the proportion of Immigrants from Bosnia and Herzegovina and percentage of family households with children in the United States with a correlation coefficient (R) of -0.255 and weighted average of 26.8%. Similarly, the statistical analysis conducted on geographies consisting of 124,355,422 people shows a substantial negative correlation between the proportion of Immigrants from Moldova and percentage of family households with children in the United States with a correlation coefficient (R) of -0.580 and weighted average of 27.6%, a difference of 3.0%.
Family Households with Children Correlation Summary
| Measurement | Immigrants from Bosnia and Herzegovina | Immigrants from Moldova |
| Minimum | 10.5% | 5.6% |
| Maximum | 38.1% | 52.3% |
| Range | 27.6% | 46.7% |
| Mean | 26.6% | 24.7% |
| Median | 26.3% | 26.6% |
| Interquartile 25% (IQ1) | 23.5% | 19.1% |
| Interquartile 75% (IQ3) | 30.4% | 29.0% |
| Interquartile Range (IQR) | 6.9% | 9.9% |
| Standard Deviation (Sample) | 5.3% | 9.0% |
| Standard Deviation (Population) | 5.3% | 8.9% |
Similar Demographics by Family Households with Children
Demographics Similar to Immigrants from Bosnia and Herzegovina by Family Households with Children
In terms of family households with children, the demographic groups most similar to Immigrants from Bosnia and Herzegovina are Irish (26.8%, a difference of 0.030%), Belgian (26.9%, a difference of 0.060%), Immigrants from Eastern Europe (26.9%, a difference of 0.070%), Immigrants from Kazakhstan (26.9%, a difference of 0.080%), and Potawatomi (26.9%, a difference of 0.090%).
| Demographics | Rating | Rank | Family Households with Children |
| Ukrainians | 2.9 /100 | #244 | Tragic 26.9% |
| Australians | 2.8 /100 | #245 | Tragic 26.9% |
| Jamaicans | 2.5 /100 | #246 | Tragic 26.9% |
| Potawatomi | 2.2 /100 | #247 | Tragic 26.9% |
| Immigrants | Kazakhstan | 2.2 /100 | #248 | Tragic 26.9% |
| Immigrants | Eastern Europe | 2.1 /100 | #249 | Tragic 26.9% |
| Belgians | 2.1 /100 | #250 | Tragic 26.9% |
| Immigrants | Bosnia and Herzegovina | 1.9 /100 | #251 | Tragic 26.8% |
| Irish | 1.8 /100 | #252 | Tragic 26.8% |
| Italians | 1.5 /100 | #253 | Tragic 26.8% |
| Immigrants | Scotland | 1.5 /100 | #254 | Tragic 26.8% |
| German Russians | 1.5 /100 | #255 | Tragic 26.8% |
| Scotch-Irish | 1.4 /100 | #256 | Tragic 26.8% |
| Slavs | 1.3 /100 | #257 | Tragic 26.8% |
| Immigrants | Cuba | 1.3 /100 | #258 | Tragic 26.8% |
Demographics Similar to Immigrants from Moldova by Family Households with Children
In terms of family households with children, the demographic groups most similar to Immigrants from Moldova are Osage (27.6%, a difference of 0.0%), Immigrants from Chile (27.7%, a difference of 0.010%), Basque (27.7%, a difference of 0.010%), Menominee (27.6%, a difference of 0.010%), and Brazilian (27.7%, a difference of 0.020%).
| Demographics | Rating | Rank | Family Households with Children |
| Spanish | 81.8 /100 | #140 | Excellent 27.7% |
| Immigrants | Eastern Asia | 81.7 /100 | #141 | Excellent 27.7% |
| Swiss | 81.4 /100 | #142 | Excellent 27.7% |
| Immigrants | Eastern Africa | 80.2 /100 | #143 | Excellent 27.7% |
| Brazilians | 79.6 /100 | #144 | Good 27.7% |
| Immigrants | Chile | 79.5 /100 | #145 | Good 27.7% |
| Basques | 79.5 /100 | #146 | Good 27.7% |
| Immigrants | Moldova | 79.1 /100 | #147 | Good 27.6% |
| Osage | 79.0 /100 | #148 | Good 27.6% |
| Menominee | 78.9 /100 | #149 | Good 27.6% |
| Argentineans | 78.5 /100 | #150 | Good 27.6% |
| Portuguese | 77.8 /100 | #151 | Good 27.6% |
| Ethiopians | 77.0 /100 | #152 | Good 27.6% |
| Immigrants | Cabo Verde | 75.6 /100 | #153 | Good 27.6% |
| Icelanders | 75.3 /100 | #154 | Good 27.6% |