Afghan vs Fijian Family Households with Children
COMPARE
Afghan
Fijian
Family Households with Children
Family Households with Children Comparison
Afghans
Fijians
30.2%
FAMILY HOUSEHOLDS WITH CHILDREN
100.0/ 100
METRIC RATING
13th/ 347
METRIC RANK
29.0%
FAMILY HOUSEHOLDS WITH CHILDREN
100.0/ 100
METRIC RATING
45th/ 347
METRIC RANK
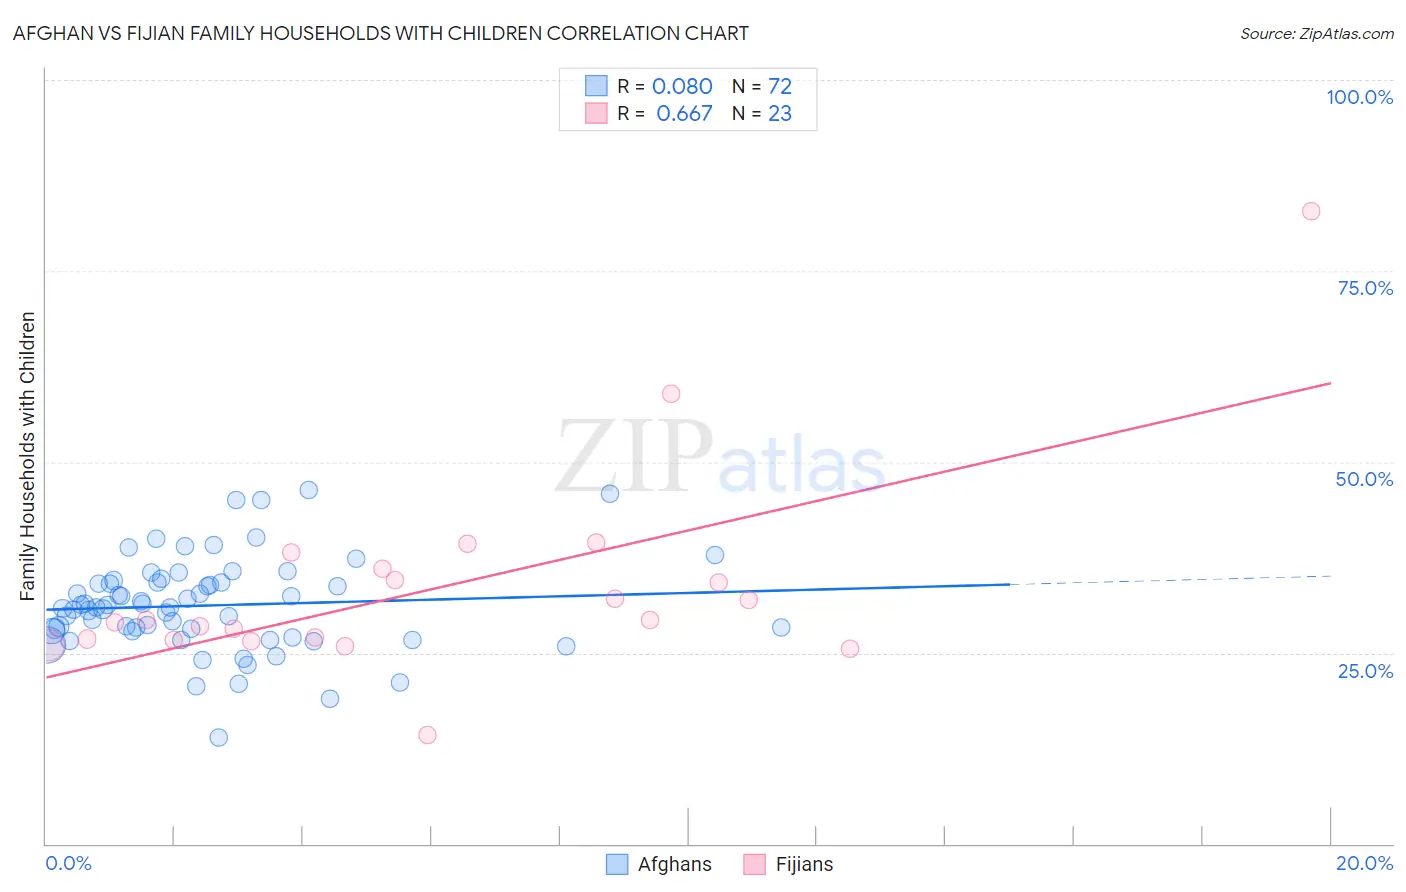
Afghan vs Fijian Family Households with Children Correlation Chart
The statistical analysis conducted on geographies consisting of 148,820,145 people shows a slight positive correlation between the proportion of Afghans and percentage of family households with children in the United States with a correlation coefficient (R) of 0.080 and weighted average of 30.2%. Similarly, the statistical analysis conducted on geographies consisting of 55,947,867 people shows a significant positive correlation between the proportion of Fijians and percentage of family households with children in the United States with a correlation coefficient (R) of 0.667 and weighted average of 29.0%, a difference of 4.0%.
Family Households with Children Correlation Summary
| Measurement | Afghan | Fijian |
| Minimum | 13.8% | 14.3% |
| Maximum | 46.4% | 82.8% |
| Range | 32.5% | 68.5% |
| Mean | 31.2% | 33.5% |
| Median | 31.0% | 29.2% |
| Interquartile 25% (IQ1) | 27.8% | 26.6% |
| Interquartile 75% (IQ3) | 34.2% | 36.0% |
| Interquartile Range (IQR) | 6.4% | 9.4% |
| Standard Deviation (Sample) | 6.1% | 13.5% |
| Standard Deviation (Population) | 6.1% | 13.2% |
Similar Demographics by Family Households with Children
Demographics Similar to Afghans by Family Households with Children
In terms of family households with children, the demographic groups most similar to Afghans are Immigrants from Pakistan (30.2%, a difference of 0.24%), Bangladeshi (30.1%, a difference of 0.28%), Immigrants from South Central Asia (30.0%, a difference of 0.46%), Immigrants from Afghanistan (30.0%, a difference of 0.48%), and Hispanic or Latino (29.9%, a difference of 0.87%).
| Demographics | Rating | Rank | Family Households with Children |
| Immigrants | India | 100.0 /100 | #6 | Exceptional 31.0% |
| Immigrants | Central America | 100.0 /100 | #7 | Exceptional 31.0% |
| Yakama | 100.0 /100 | #8 | Exceptional 30.8% |
| Thais | 100.0 /100 | #9 | Exceptional 30.6% |
| Immigrants | Fiji | 100.0 /100 | #10 | Exceptional 30.5% |
| Nepalese | 100.0 /100 | #11 | Exceptional 30.5% |
| Immigrants | Pakistan | 100.0 /100 | #12 | Exceptional 30.2% |
| Afghans | 100.0 /100 | #13 | Exceptional 30.2% |
| Bangladeshis | 100.0 /100 | #14 | Exceptional 30.1% |
| Immigrants | South Central Asia | 100.0 /100 | #15 | Exceptional 30.0% |
| Immigrants | Afghanistan | 100.0 /100 | #16 | Exceptional 30.0% |
| Hispanics or Latinos | 100.0 /100 | #17 | Exceptional 29.9% |
| Salvadorans | 100.0 /100 | #18 | Exceptional 29.9% |
| Alaska Natives | 100.0 /100 | #19 | Exceptional 29.9% |
| Immigrants | El Salvador | 100.0 /100 | #20 | Exceptional 29.8% |
Demographics Similar to Fijians by Family Households with Children
In terms of family households with children, the demographic groups most similar to Fijians are Immigrants from Taiwan (29.0%, a difference of 0.060%), Immigrants from Philippines (29.0%, a difference of 0.090%), Peruvian (29.0%, a difference of 0.090%), Asian (29.1%, a difference of 0.10%), and Apache (29.0%, a difference of 0.13%).
| Demographics | Rating | Rank | Family Households with Children |
| Koreans | 100.0 /100 | #38 | Exceptional 29.2% |
| Yaqui | 100.0 /100 | #39 | Exceptional 29.1% |
| Central Americans | 100.0 /100 | #40 | Exceptional 29.1% |
| Immigrants | South Eastern Asia | 100.0 /100 | #41 | Exceptional 29.1% |
| Spanish American Indians | 100.0 /100 | #42 | Exceptional 29.1% |
| Asians | 100.0 /100 | #43 | Exceptional 29.1% |
| Immigrants | Taiwan | 100.0 /100 | #44 | Exceptional 29.0% |
| Fijians | 100.0 /100 | #45 | Exceptional 29.0% |
| Immigrants | Philippines | 100.0 /100 | #46 | Exceptional 29.0% |
| Peruvians | 100.0 /100 | #47 | Exceptional 29.0% |
| Apache | 100.0 /100 | #48 | Exceptional 29.0% |
| Jordanians | 100.0 /100 | #49 | Exceptional 29.0% |
| Immigrants | Immigrants | 100.0 /100 | #50 | Exceptional 28.9% |
| Immigrants | Peru | 100.0 /100 | #51 | Exceptional 28.9% |
| Guatemalans | 100.0 /100 | #52 | Exceptional 28.9% |