Zimbabwean vs Immigrants from Jamaica Professional Degree
COMPARE
Zimbabwean
Immigrants from Jamaica
Professional Degree
Professional Degree Comparison
Zimbabweans
Immigrants from Jamaica
5.2%
PROFESSIONAL DEGREE
99.3/ 100
METRIC RATING
95th/ 347
METRIC RANK
3.6%
PROFESSIONAL DEGREE
0.5/ 100
METRIC RATING
272nd/ 347
METRIC RANK
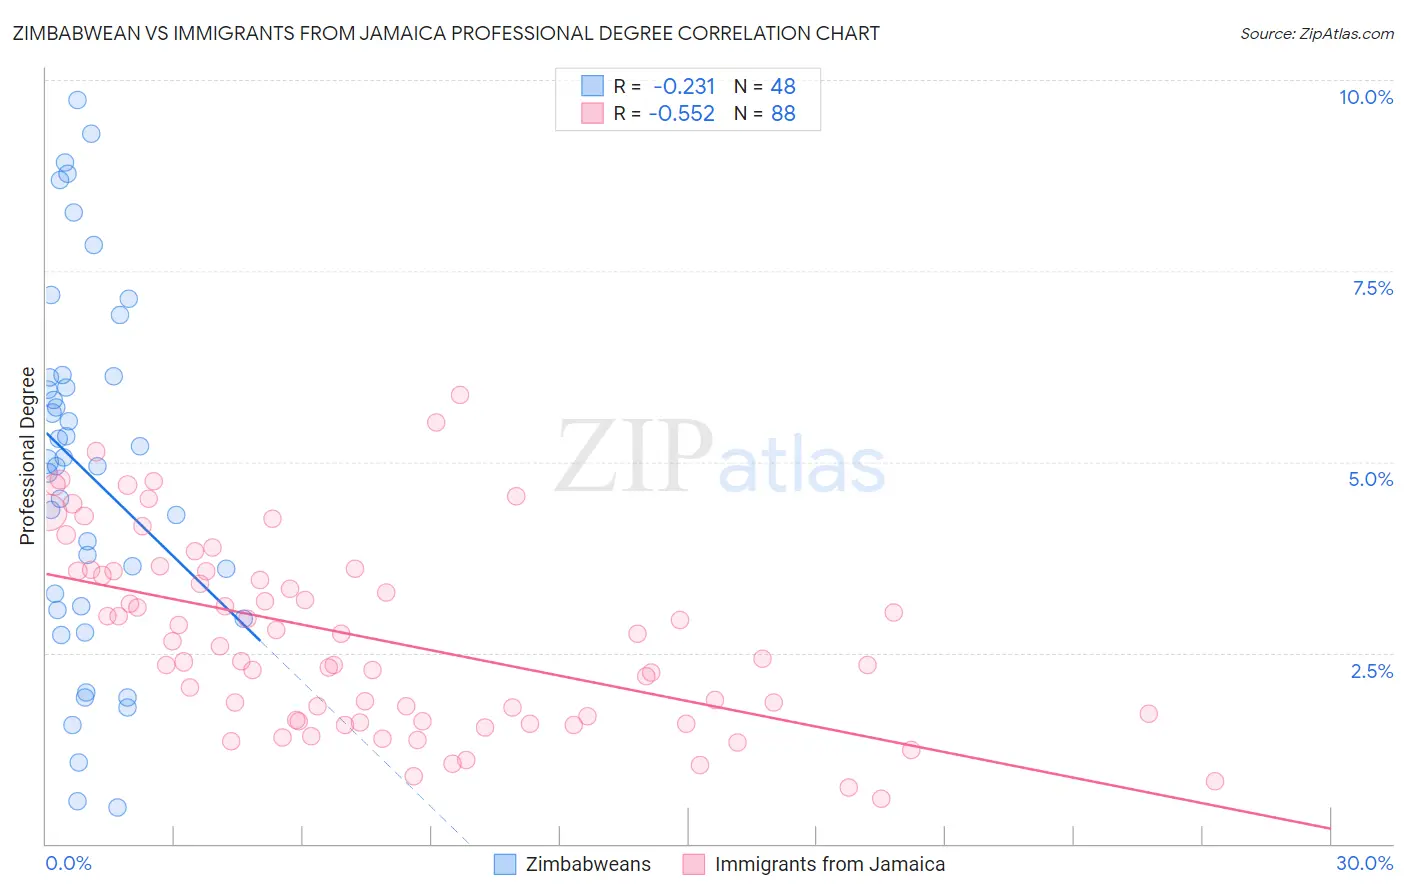
Zimbabwean vs Immigrants from Jamaica Professional Degree Correlation Chart
The statistical analysis conducted on geographies consisting of 69,179,239 people shows a weak negative correlation between the proportion of Zimbabweans and percentage of population with at least professional degree education in the United States with a correlation coefficient (R) of -0.231 and weighted average of 5.2%. Similarly, the statistical analysis conducted on geographies consisting of 301,293,003 people shows a substantial negative correlation between the proportion of Immigrants from Jamaica and percentage of population with at least professional degree education in the United States with a correlation coefficient (R) of -0.552 and weighted average of 3.6%, a difference of 45.7%.
Professional Degree Correlation Summary
| Measurement | Zimbabwean | Immigrants from Jamaica |
| Minimum | 0.48% | 0.59% |
| Maximum | 9.7% | 5.9% |
| Range | 9.3% | 5.3% |
| Mean | 4.9% | 2.7% |
| Median | 5.0% | 2.5% |
| Interquartile 25% (IQ1) | 3.1% | 1.6% |
| Interquartile 75% (IQ3) | 6.1% | 3.6% |
| Interquartile Range (IQR) | 3.0% | 2.0% |
| Standard Deviation (Sample) | 2.4% | 1.2% |
| Standard Deviation (Population) | 2.3% | 1.2% |
Similar Demographics by Professional Degree
Demographics Similar to Zimbabweans by Professional Degree
In terms of professional degree, the demographic groups most similar to Zimbabweans are Alsatian (5.2%, a difference of 0.18%), Northern European (5.2%, a difference of 0.20%), Immigrants from Uzbekistan (5.2%, a difference of 0.41%), Syrian (5.2%, a difference of 0.75%), and Austrian (5.2%, a difference of 0.78%).
| Demographics | Rating | Rank | Professional Degree |
| Egyptians | 99.5 /100 | #88 | Exceptional 5.3% |
| Chileans | 99.5 /100 | #89 | Exceptional 5.3% |
| Immigrants | Scotland | 99.5 /100 | #90 | Exceptional 5.3% |
| Laotians | 99.5 /100 | #91 | Exceptional 5.2% |
| Immigrants | Eastern Europe | 99.5 /100 | #92 | Exceptional 5.2% |
| Northern Europeans | 99.3 /100 | #93 | Exceptional 5.2% |
| Alsatians | 99.3 /100 | #94 | Exceptional 5.2% |
| Zimbabweans | 99.3 /100 | #95 | Exceptional 5.2% |
| Immigrants | Uzbekistan | 99.2 /100 | #96 | Exceptional 5.2% |
| Syrians | 99.1 /100 | #97 | Exceptional 5.2% |
| Austrians | 99.1 /100 | #98 | Exceptional 5.2% |
| Immigrants | Italy | 99.1 /100 | #99 | Exceptional 5.2% |
| Ugandans | 98.8 /100 | #100 | Exceptional 5.1% |
| Immigrants | Egypt | 98.5 /100 | #101 | Exceptional 5.1% |
| Ukrainians | 98.5 /100 | #102 | Exceptional 5.1% |
Demographics Similar to Immigrants from Jamaica by Professional Degree
In terms of professional degree, the demographic groups most similar to Immigrants from Jamaica are Belizean (3.6%, a difference of 0.030%), American (3.6%, a difference of 0.060%), Potawatomi (3.6%, a difference of 0.19%), Immigrants from Dominica (3.6%, a difference of 0.42%), and Liberian (3.6%, a difference of 0.46%).
| Demographics | Rating | Rank | Professional Degree |
| Immigrants | Congo | 0.8 /100 | #265 | Tragic 3.6% |
| Central American Indians | 0.8 /100 | #266 | Tragic 3.6% |
| Delaware | 0.7 /100 | #267 | Tragic 3.6% |
| Aleuts | 0.7 /100 | #268 | Tragic 3.6% |
| Immigrants | Cuba | 0.6 /100 | #269 | Tragic 3.6% |
| Central Americans | 0.6 /100 | #270 | Tragic 3.6% |
| Belizeans | 0.5 /100 | #271 | Tragic 3.6% |
| Immigrants | Jamaica | 0.5 /100 | #272 | Tragic 3.6% |
| Americans | 0.5 /100 | #273 | Tragic 3.6% |
| Potawatomi | 0.5 /100 | #274 | Tragic 3.6% |
| Immigrants | Dominica | 0.5 /100 | #275 | Tragic 3.6% |
| Liberians | 0.5 /100 | #276 | Tragic 3.6% |
| Cheyenne | 0.5 /100 | #277 | Tragic 3.6% |
| Japanese | 0.5 /100 | #278 | Tragic 3.5% |
| Immigrants | Portugal | 0.5 /100 | #279 | Tragic 3.5% |