Yup'ik vs Shoshone College, Under 1 year
COMPARE
Yup'ik
Shoshone
College, Under 1 year
College, Under 1 year Comparison
Yup'ik
Shoshone
45.8%
COLLEGE, UNDER 1 YEAR
0.0/ 100
METRIC RATING
347th/ 347
METRIC RANK
61.1%
COLLEGE, UNDER 1 YEAR
0.2/ 100
METRIC RATING
263rd/ 347
METRIC RANK
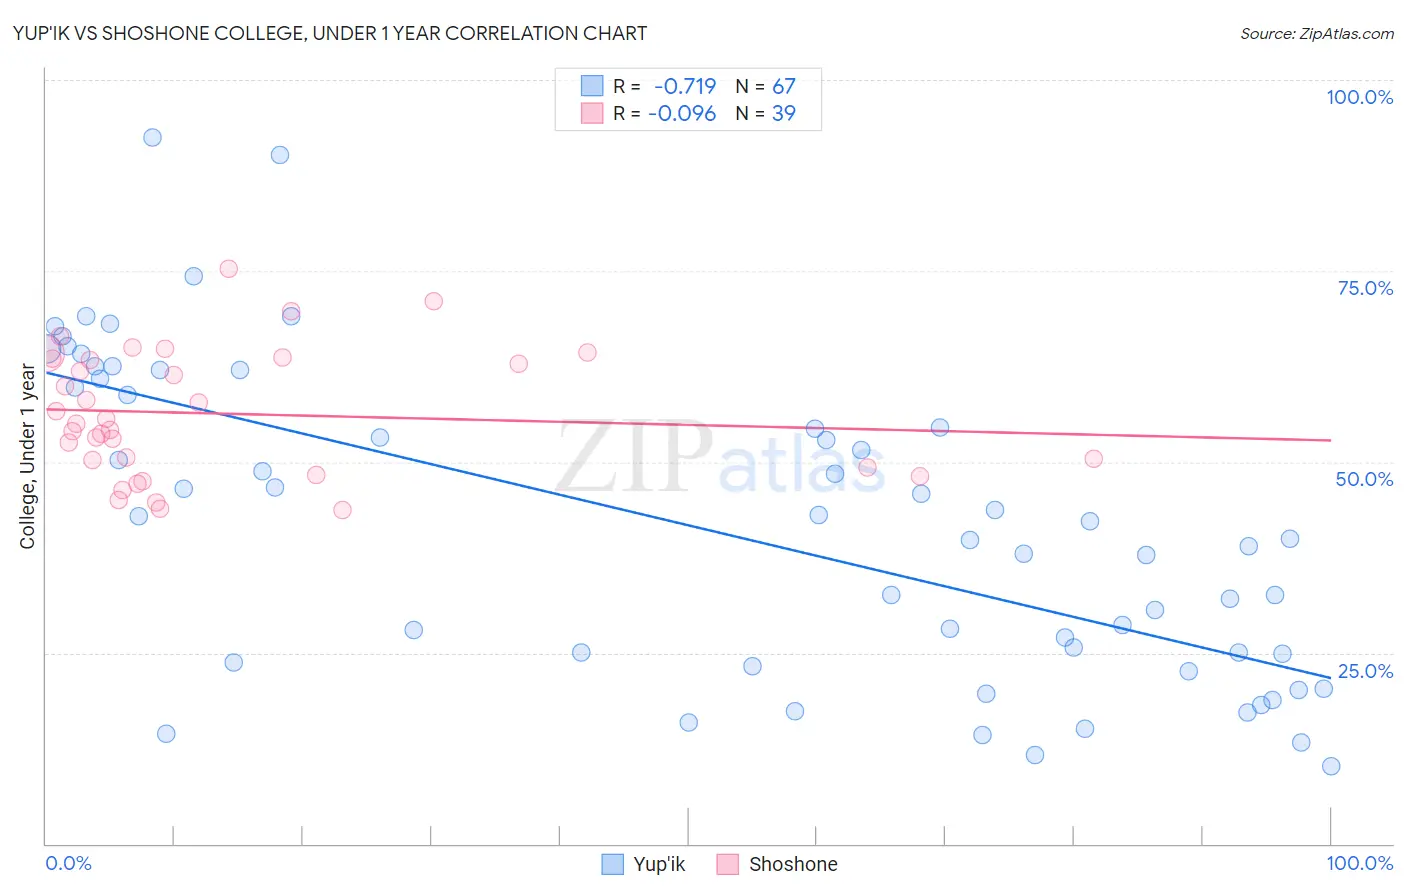
Yup'ik vs Shoshone College, Under 1 year Correlation Chart
The statistical analysis conducted on geographies consisting of 39,964,395 people shows a strong negative correlation between the proportion of Yup'ik and percentage of population with at least college, under 1 year education in the United States with a correlation coefficient (R) of -0.719 and weighted average of 45.8%. Similarly, the statistical analysis conducted on geographies consisting of 66,627,303 people shows a slight negative correlation between the proportion of Shoshone and percentage of population with at least college, under 1 year education in the United States with a correlation coefficient (R) of -0.096 and weighted average of 61.1%, a difference of 33.5%.
College, Under 1 year Correlation Summary
| Measurement | Yup'ik | Shoshone |
| Minimum | 10.2% | 43.7% |
| Maximum | 92.4% | 75.3% |
| Range | 82.2% | 31.6% |
| Mean | 41.4% | 56.3% |
| Median | 40.0% | 55.0% |
| Interquartile 25% (IQ1) | 23.8% | 49.3% |
| Interquartile 75% (IQ3) | 59.8% | 63.5% |
| Interquartile Range (IQR) | 36.0% | 14.2% |
| Standard Deviation (Sample) | 20.3% | 8.2% |
| Standard Deviation (Population) | 20.2% | 8.1% |
Similar Demographics by College, Under 1 year
Demographics Similar to Yup'ik by College, Under 1 year
In terms of college, under 1 year, the demographic groups most similar to Yup'ik are Houma (47.6%, a difference of 4.1%), Pima (51.4%, a difference of 12.4%), Yakama (52.6%, a difference of 15.0%), Tohono O'odham (52.8%, a difference of 15.3%), and Immigrants from Mexico (53.7%, a difference of 17.2%).
| Demographics | Rating | Rank | College, Under 1 year |
| Yuman | 0.0 /100 | #333 | Tragic 55.1% |
| Immigrants | Azores | 0.0 /100 | #334 | Tragic 54.7% |
| Inupiat | 0.0 /100 | #335 | Tragic 54.6% |
| Pennsylvania Germans | 0.0 /100 | #336 | Tragic 54.5% |
| Immigrants | Central America | 0.0 /100 | #337 | Tragic 54.4% |
| Lumbee | 0.0 /100 | #338 | Tragic 54.2% |
| Immigrants | Dominican Republic | 0.0 /100 | #339 | Tragic 54.0% |
| Spanish American Indians | 0.0 /100 | #340 | Tragic 54.0% |
| Immigrants | Cabo Verde | 0.0 /100 | #341 | Tragic 53.7% |
| Immigrants | Mexico | 0.0 /100 | #342 | Tragic 53.7% |
| Tohono O'odham | 0.0 /100 | #343 | Tragic 52.8% |
| Yakama | 0.0 /100 | #344 | Tragic 52.6% |
| Pima | 0.0 /100 | #345 | Tragic 51.4% |
| Houma | 0.0 /100 | #346 | Tragic 47.6% |
| Yup'ik | 0.0 /100 | #347 | Tragic 45.8% |
Demographics Similar to Shoshone by College, Under 1 year
In terms of college, under 1 year, the demographic groups most similar to Shoshone are Barbadian (61.1%, a difference of 0.010%), African (61.1%, a difference of 0.050%), Trinidadian and Tobagonian (61.1%, a difference of 0.060%), Immigrants from Bahamas (61.1%, a difference of 0.060%), and Blackfeet (61.1%, a difference of 0.070%).
| Demographics | Rating | Rank | College, Under 1 year |
| Bangladeshis | 0.4 /100 | #256 | Tragic 61.4% |
| Immigrants | Laos | 0.3 /100 | #257 | Tragic 61.3% |
| Immigrants | Bangladesh | 0.3 /100 | #258 | Tragic 61.3% |
| Indonesians | 0.3 /100 | #259 | Tragic 61.2% |
| Blackfeet | 0.3 /100 | #260 | Tragic 61.1% |
| Africans | 0.3 /100 | #261 | Tragic 61.1% |
| Barbadians | 0.2 /100 | #262 | Tragic 61.1% |
| Shoshone | 0.2 /100 | #263 | Tragic 61.1% |
| Trinidadians and Tobagonians | 0.2 /100 | #264 | Tragic 61.1% |
| Immigrants | Bahamas | 0.2 /100 | #265 | Tragic 61.1% |
| Alaskan Athabascans | 0.2 /100 | #266 | Tragic 61.0% |
| Americans | 0.2 /100 | #267 | Tragic 61.0% |
| Immigrants | Trinidad and Tobago | 0.1 /100 | #268 | Tragic 60.7% |
| Immigrants | West Indies | 0.1 /100 | #269 | Tragic 60.6% |
| Cheyenne | 0.1 /100 | #270 | Tragic 60.6% |