Yuman vs Immigrants from Israel Professional Degree
COMPARE
Yuman
Immigrants from Israel
Professional Degree
Professional Degree Comparison
Yuman
Immigrants from Israel
3.3%
PROFESSIONAL DEGREE
0.1/ 100
METRIC RATING
313th/ 347
METRIC RANK
7.9%
PROFESSIONAL DEGREE
100.0/ 100
METRIC RATING
1st/ 347
METRIC RANK
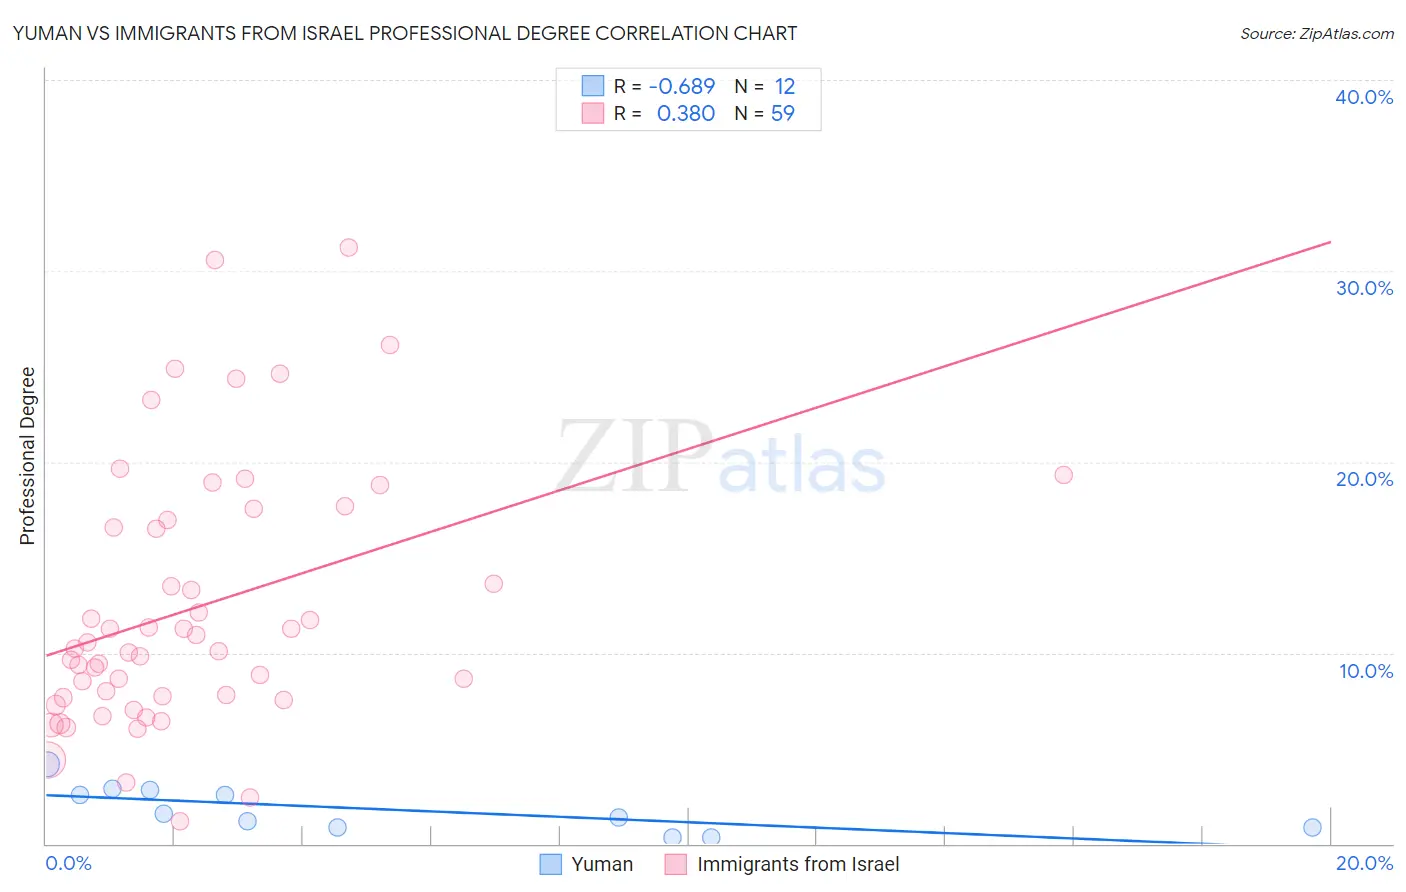
Yuman vs Immigrants from Israel Professional Degree Correlation Chart
The statistical analysis conducted on geographies consisting of 40,606,596 people shows a significant negative correlation between the proportion of Yuman and percentage of population with at least professional degree education in the United States with a correlation coefficient (R) of -0.689 and weighted average of 3.3%. Similarly, the statistical analysis conducted on geographies consisting of 209,922,622 people shows a mild positive correlation between the proportion of Immigrants from Israel and percentage of population with at least professional degree education in the United States with a correlation coefficient (R) of 0.380 and weighted average of 7.9%, a difference of 139.9%.
Professional Degree Correlation Summary
| Measurement | Yuman | Immigrants from Israel |
| Minimum | 0.30% | 1.2% |
| Maximum | 4.2% | 31.2% |
| Range | 3.9% | 30.0% |
| Mean | 1.8% | 12.4% |
| Median | 1.5% | 10.2% |
| Interquartile 25% (IQ1) | 0.85% | 7.6% |
| Interquartile 75% (IQ3) | 2.7% | 17.0% |
| Interquartile Range (IQR) | 1.8% | 9.3% |
| Standard Deviation (Sample) | 1.2% | 6.8% |
| Standard Deviation (Population) | 1.1% | 6.8% |
Similar Demographics by Professional Degree
Demographics Similar to Yuman by Professional Degree
In terms of professional degree, the demographic groups most similar to Yuman are Sioux (3.3%, a difference of 0.010%), Mexican American Indian (3.3%, a difference of 0.21%), Cherokee (3.3%, a difference of 0.60%), Immigrants from Latin America (3.3%, a difference of 0.76%), and Immigrants from Laos (3.2%, a difference of 0.89%).
| Demographics | Rating | Rank | Professional Degree |
| Cape Verdeans | 0.1 /100 | #306 | Tragic 3.4% |
| Samoans | 0.1 /100 | #307 | Tragic 3.3% |
| Shoshone | 0.1 /100 | #308 | Tragic 3.3% |
| Pima | 0.1 /100 | #309 | Tragic 3.3% |
| Immigrants | Latin America | 0.1 /100 | #310 | Tragic 3.3% |
| Cherokee | 0.1 /100 | #311 | Tragic 3.3% |
| Sioux | 0.1 /100 | #312 | Tragic 3.3% |
| Yuman | 0.1 /100 | #313 | Tragic 3.3% |
| Mexican American Indians | 0.1 /100 | #314 | Tragic 3.3% |
| Immigrants | Laos | 0.1 /100 | #315 | Tragic 3.2% |
| Puerto Ricans | 0.1 /100 | #316 | Tragic 3.2% |
| Nepalese | 0.1 /100 | #317 | Tragic 3.2% |
| Immigrants | Micronesia | 0.1 /100 | #318 | Tragic 3.2% |
| Choctaw | 0.1 /100 | #319 | Tragic 3.2% |
| Seminole | 0.1 /100 | #320 | Tragic 3.2% |
Demographics Similar to Immigrants from Israel by Professional Degree
In terms of professional degree, the demographic groups most similar to Immigrants from Israel are Immigrants from Singapore (7.7%, a difference of 1.4%), Iranian (7.6%, a difference of 3.1%), Filipino (7.6%, a difference of 3.9%), Immigrants from Iran (7.3%, a difference of 7.2%), and Okinawan (7.3%, a difference of 7.3%).
| Demographics | Rating | Rank | Professional Degree |
| Immigrants | Israel | 100.0 /100 | #1 | Exceptional 7.9% |
| Immigrants | Singapore | 100.0 /100 | #2 | Exceptional 7.7% |
| Iranians | 100.0 /100 | #3 | Exceptional 7.6% |
| Filipinos | 100.0 /100 | #4 | Exceptional 7.6% |
| Immigrants | Iran | 100.0 /100 | #5 | Exceptional 7.3% |
| Okinawans | 100.0 /100 | #6 | Exceptional 7.3% |
| Eastern Europeans | 100.0 /100 | #7 | Exceptional 7.1% |
| Immigrants | Switzerland | 100.0 /100 | #8 | Exceptional 7.1% |
| Immigrants | Taiwan | 100.0 /100 | #9 | Exceptional 7.1% |
| Immigrants | Belgium | 100.0 /100 | #10 | Exceptional 7.0% |
| Cypriots | 100.0 /100 | #11 | Exceptional 6.9% |
| Israelis | 100.0 /100 | #12 | Exceptional 6.9% |
| Immigrants | Australia | 100.0 /100 | #13 | Exceptional 6.9% |
| Immigrants | France | 100.0 /100 | #14 | Exceptional 6.8% |
| Immigrants | China | 100.0 /100 | #15 | Exceptional 6.7% |