Yuman vs Haitian Professional Degree
COMPARE
Yuman
Haitian
Professional Degree
Professional Degree Comparison
Yuman
Haitians
3.3%
PROFESSIONAL DEGREE
0.1/ 100
METRIC RATING
313th/ 347
METRIC RANK
3.5%
PROFESSIONAL DEGREE
0.3/ 100
METRIC RATING
286th/ 347
METRIC RANK
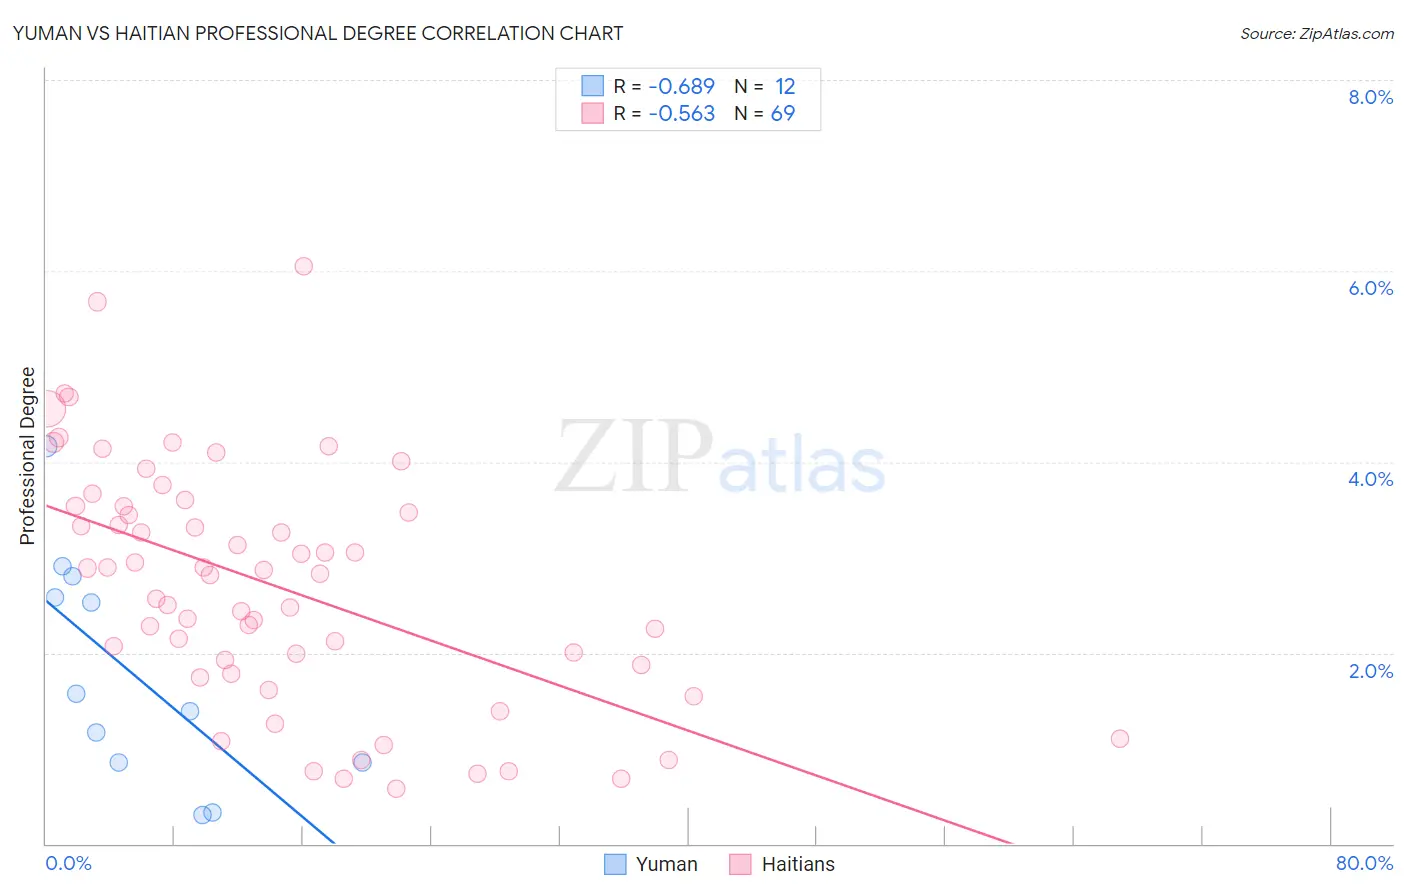
Yuman vs Haitian Professional Degree Correlation Chart
The statistical analysis conducted on geographies consisting of 40,606,596 people shows a significant negative correlation between the proportion of Yuman and percentage of population with at least professional degree education in the United States with a correlation coefficient (R) of -0.689 and weighted average of 3.3%. Similarly, the statistical analysis conducted on geographies consisting of 287,367,803 people shows a substantial negative correlation between the proportion of Haitians and percentage of population with at least professional degree education in the United States with a correlation coefficient (R) of -0.563 and weighted average of 3.5%, a difference of 6.3%.
Professional Degree Correlation Summary
| Measurement | Yuman | Haitian |
| Minimum | 0.30% | 0.57% |
| Maximum | 4.2% | 6.1% |
| Range | 3.9% | 5.5% |
| Mean | 1.8% | 2.7% |
| Median | 1.5% | 2.8% |
| Interquartile 25% (IQ1) | 0.85% | 1.8% |
| Interquartile 75% (IQ3) | 2.7% | 3.5% |
| Interquartile Range (IQR) | 1.8% | 1.7% |
| Standard Deviation (Sample) | 1.2% | 1.3% |
| Standard Deviation (Population) | 1.1% | 1.2% |
Similar Demographics by Professional Degree
Demographics Similar to Yuman by Professional Degree
In terms of professional degree, the demographic groups most similar to Yuman are Sioux (3.3%, a difference of 0.010%), Mexican American Indian (3.3%, a difference of 0.21%), Cherokee (3.3%, a difference of 0.60%), Immigrants from Latin America (3.3%, a difference of 0.76%), and Immigrants from Laos (3.2%, a difference of 0.89%).
| Demographics | Rating | Rank | Professional Degree |
| Cape Verdeans | 0.1 /100 | #306 | Tragic 3.4% |
| Samoans | 0.1 /100 | #307 | Tragic 3.3% |
| Shoshone | 0.1 /100 | #308 | Tragic 3.3% |
| Pima | 0.1 /100 | #309 | Tragic 3.3% |
| Immigrants | Latin America | 0.1 /100 | #310 | Tragic 3.3% |
| Cherokee | 0.1 /100 | #311 | Tragic 3.3% |
| Sioux | 0.1 /100 | #312 | Tragic 3.3% |
| Yuman | 0.1 /100 | #313 | Tragic 3.3% |
| Mexican American Indians | 0.1 /100 | #314 | Tragic 3.3% |
| Immigrants | Laos | 0.1 /100 | #315 | Tragic 3.2% |
| Puerto Ricans | 0.1 /100 | #316 | Tragic 3.2% |
| Nepalese | 0.1 /100 | #317 | Tragic 3.2% |
| Immigrants | Micronesia | 0.1 /100 | #318 | Tragic 3.2% |
| Choctaw | 0.1 /100 | #319 | Tragic 3.2% |
| Seminole | 0.1 /100 | #320 | Tragic 3.2% |
Demographics Similar to Haitians by Professional Degree
In terms of professional degree, the demographic groups most similar to Haitians are Immigrants from El Salvador (3.5%, a difference of 0.10%), Blackfeet (3.5%, a difference of 0.15%), Guatemalan (3.5%, a difference of 0.32%), Chippewa (3.5%, a difference of 0.33%), and Honduran (3.5%, a difference of 0.34%).
| Demographics | Rating | Rank | Professional Degree |
| Immigrants | Portugal | 0.5 /100 | #279 | Tragic 3.5% |
| Dominicans | 0.5 /100 | #280 | Tragic 3.5% |
| Apache | 0.5 /100 | #281 | Tragic 3.5% |
| Immigrants | Caribbean | 0.5 /100 | #282 | Tragic 3.5% |
| Comanche | 0.4 /100 | #283 | Tragic 3.5% |
| Salvadorans | 0.4 /100 | #284 | Tragic 3.5% |
| Hondurans | 0.3 /100 | #285 | Tragic 3.5% |
| Haitians | 0.3 /100 | #286 | Tragic 3.5% |
| Immigrants | El Salvador | 0.3 /100 | #287 | Tragic 3.5% |
| Blackfeet | 0.3 /100 | #288 | Tragic 3.5% |
| Guatemalans | 0.3 /100 | #289 | Tragic 3.5% |
| Chippewa | 0.3 /100 | #290 | Tragic 3.5% |
| Alaska Natives | 0.3 /100 | #291 | Tragic 3.5% |
| Immigrants | Belize | 0.3 /100 | #292 | Tragic 3.5% |
| Immigrants | Honduras | 0.3 /100 | #293 | Tragic 3.5% |