Yaqui vs Immigrants from Uzbekistan Doctorate Degree
COMPARE
Yaqui
Immigrants from Uzbekistan
Doctorate Degree
Doctorate Degree Comparison
Yaqui
Immigrants from Uzbekistan
1.5%
DOCTORATE DEGREE
0.4/ 100
METRIC RATING
274th/ 347
METRIC RANK
2.0%
DOCTORATE DEGREE
89.3/ 100
METRIC RATING
133rd/ 347
METRIC RANK
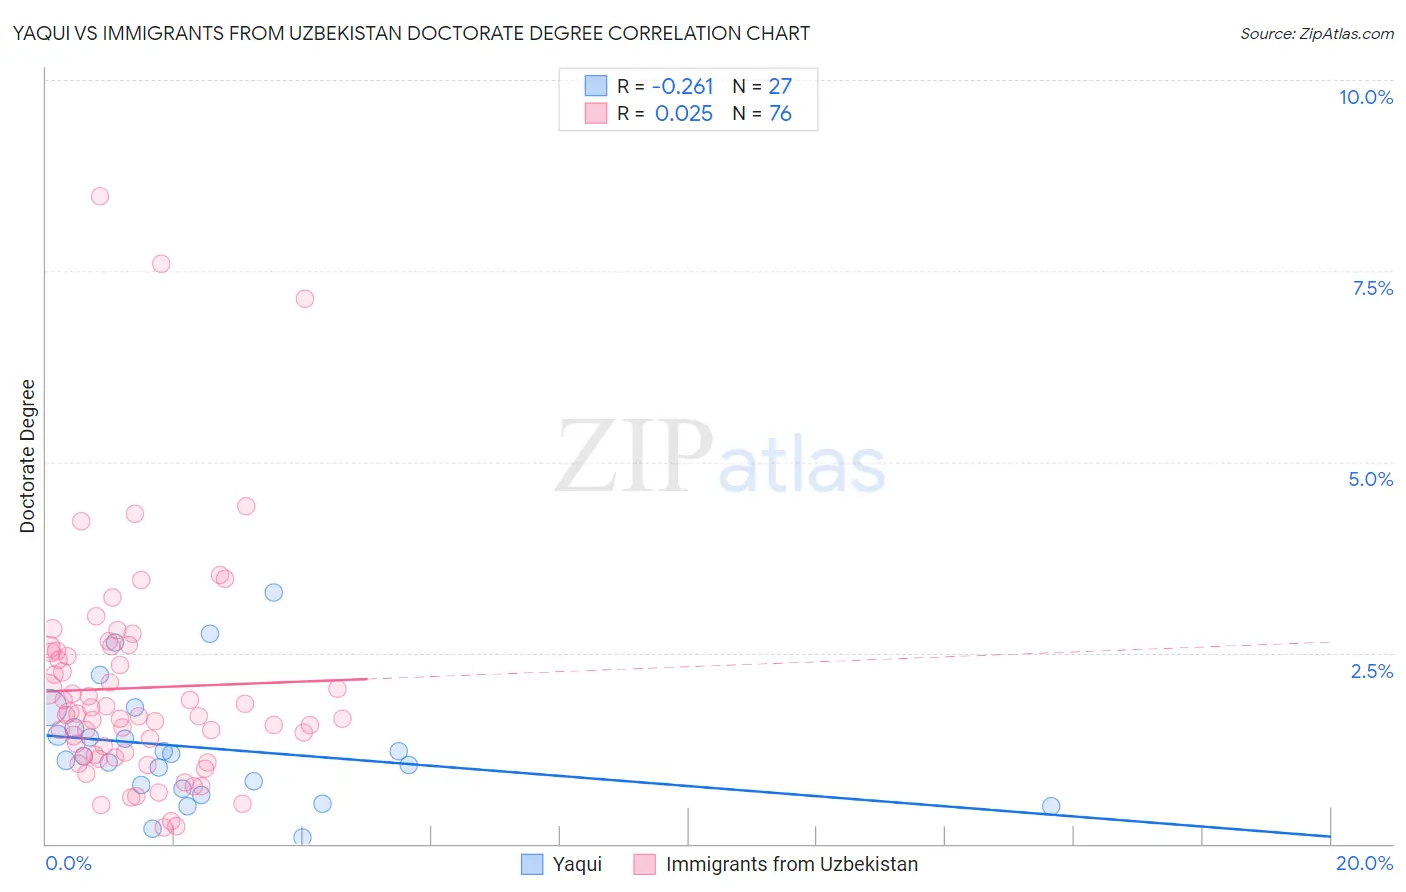
Yaqui vs Immigrants from Uzbekistan Doctorate Degree Correlation Chart
The statistical analysis conducted on geographies consisting of 107,124,723 people shows a weak negative correlation between the proportion of Yaqui and percentage of population with at least doctorate degree education in the United States with a correlation coefficient (R) of -0.261 and weighted average of 1.5%. Similarly, the statistical analysis conducted on geographies consisting of 118,602,748 people shows no correlation between the proportion of Immigrants from Uzbekistan and percentage of population with at least doctorate degree education in the United States with a correlation coefficient (R) of 0.025 and weighted average of 2.0%, a difference of 34.6%.
Doctorate Degree Correlation Summary
| Measurement | Yaqui | Immigrants from Uzbekistan |
| Minimum | 0.075% | 0.21% |
| Maximum | 3.3% | 8.5% |
| Range | 3.2% | 8.3% |
| Mean | 1.3% | 2.0% |
| Median | 1.1% | 1.7% |
| Interquartile 25% (IQ1) | 0.73% | 1.1% |
| Interquartile 75% (IQ3) | 1.5% | 2.5% |
| Interquartile Range (IQR) | 0.79% | 1.4% |
| Standard Deviation (Sample) | 0.77% | 1.5% |
| Standard Deviation (Population) | 0.76% | 1.5% |
Similar Demographics by Doctorate Degree
Demographics Similar to Yaqui by Doctorate Degree
In terms of doctorate degree, the demographic groups most similar to Yaqui are Sioux (1.5%, a difference of 0.020%), Aleut (1.5%, a difference of 0.12%), Immigrants from Barbados (1.5%, a difference of 0.13%), Paiute (1.5%, a difference of 0.17%), and Immigrants from Trinidad and Tobago (1.5%, a difference of 0.22%).
| Demographics | Rating | Rank | Doctorate Degree |
| Kiowa | 0.5 /100 | #267 | Tragic 1.5% |
| U.S. Virgin Islanders | 0.5 /100 | #268 | Tragic 1.5% |
| Crow | 0.5 /100 | #269 | Tragic 1.5% |
| Salvadorans | 0.5 /100 | #270 | Tragic 1.5% |
| Immigrants | Trinidad and Tobago | 0.5 /100 | #271 | Tragic 1.5% |
| Immigrants | Barbados | 0.4 /100 | #272 | Tragic 1.5% |
| Sioux | 0.4 /100 | #273 | Tragic 1.5% |
| Yaqui | 0.4 /100 | #274 | Tragic 1.5% |
| Aleuts | 0.4 /100 | #275 | Tragic 1.5% |
| Paiute | 0.4 /100 | #276 | Tragic 1.5% |
| Bahamians | 0.4 /100 | #277 | Tragic 1.5% |
| Hawaiians | 0.4 /100 | #278 | Tragic 1.5% |
| Marshallese | 0.4 /100 | #279 | Tragic 1.5% |
| Ecuadorians | 0.4 /100 | #280 | Tragic 1.5% |
| Tohono O'odham | 0.4 /100 | #281 | Tragic 1.5% |
Demographics Similar to Immigrants from Uzbekistan by Doctorate Degree
In terms of doctorate degree, the demographic groups most similar to Immigrants from Uzbekistan are Scottish (2.0%, a difference of 0.050%), Immigrants from Cameroon (2.0%, a difference of 0.15%), Serbian (2.0%, a difference of 0.21%), Immigrants from Sierra Leone (2.0%, a difference of 0.33%), and Swedish (2.0%, a difference of 0.36%).
| Demographics | Rating | Rank | Doctorate Degree |
| Jordanians | 92.1 /100 | #126 | Exceptional 2.0% |
| Palestinians | 92.0 /100 | #127 | Exceptional 2.0% |
| Immigrants | Zaire | 91.1 /100 | #128 | Exceptional 2.0% |
| Canadians | 90.6 /100 | #129 | Exceptional 2.0% |
| Immigrants | Ukraine | 90.5 /100 | #130 | Exceptional 2.0% |
| Immigrants | Sierra Leone | 90.2 /100 | #131 | Exceptional 2.0% |
| Scottish | 89.4 /100 | #132 | Excellent 2.0% |
| Immigrants | Uzbekistan | 89.3 /100 | #133 | Excellent 2.0% |
| Immigrants | Cameroon | 88.9 /100 | #134 | Excellent 2.0% |
| Serbians | 88.7 /100 | #135 | Excellent 2.0% |
| Swedes | 88.3 /100 | #136 | Excellent 2.0% |
| South American Indians | 88.3 /100 | #137 | Excellent 2.0% |
| Swiss | 88.0 /100 | #138 | Excellent 2.0% |
| Afghans | 87.2 /100 | #139 | Excellent 2.0% |
| Immigrants | Africa | 87.0 /100 | #140 | Excellent 2.0% |