Yaqui vs Indian (Asian) Doctorate Degree
COMPARE
Yaqui
Indian (Asian)
Doctorate Degree
Doctorate Degree Comparison
Yaqui
Indians (Asian)
1.5%
DOCTORATE DEGREE
0.4/ 100
METRIC RATING
274th/ 347
METRIC RANK
2.9%
DOCTORATE DEGREE
100.0/ 100
METRIC RATING
11th/ 347
METRIC RANK
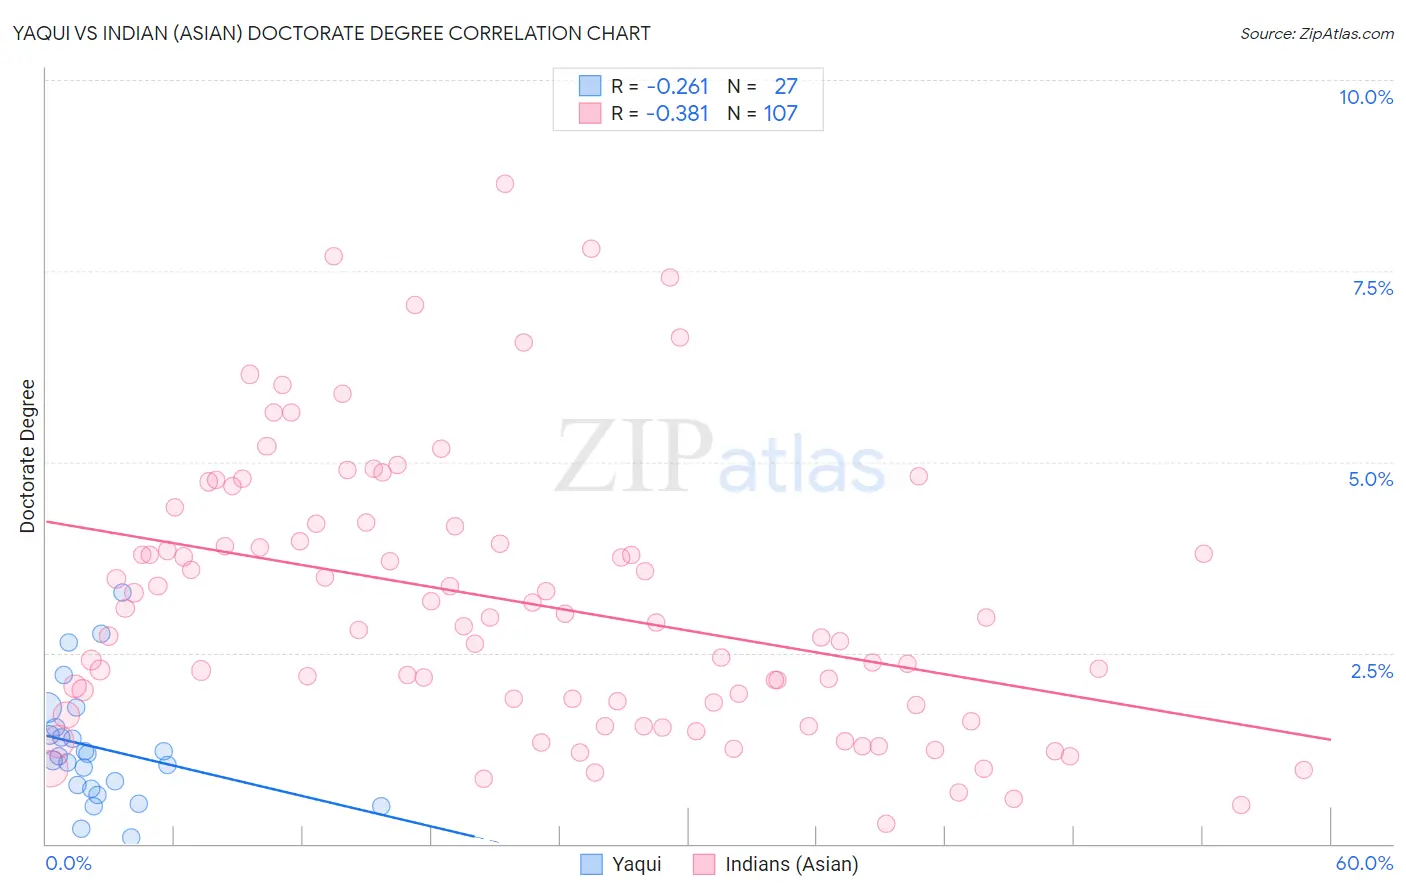
Yaqui vs Indian (Asian) Doctorate Degree Correlation Chart
The statistical analysis conducted on geographies consisting of 107,124,723 people shows a weak negative correlation between the proportion of Yaqui and percentage of population with at least doctorate degree education in the United States with a correlation coefficient (R) of -0.261 and weighted average of 1.5%. Similarly, the statistical analysis conducted on geographies consisting of 487,771,448 people shows a mild negative correlation between the proportion of Indians (Asian) and percentage of population with at least doctorate degree education in the United States with a correlation coefficient (R) of -0.381 and weighted average of 2.9%, a difference of 97.6%.
Doctorate Degree Correlation Summary
| Measurement | Yaqui | Indian (Asian) |
| Minimum | 0.075% | 0.26% |
| Maximum | 3.3% | 8.6% |
| Range | 3.2% | 8.4% |
| Mean | 1.3% | 3.2% |
| Median | 1.1% | 2.9% |
| Interquartile 25% (IQ1) | 0.73% | 1.8% |
| Interquartile 75% (IQ3) | 1.5% | 4.2% |
| Interquartile Range (IQR) | 0.79% | 2.3% |
| Standard Deviation (Sample) | 0.77% | 1.8% |
| Standard Deviation (Population) | 0.76% | 1.8% |
Similar Demographics by Doctorate Degree
Demographics Similar to Yaqui by Doctorate Degree
In terms of doctorate degree, the demographic groups most similar to Yaqui are Sioux (1.5%, a difference of 0.020%), Aleut (1.5%, a difference of 0.12%), Immigrants from Barbados (1.5%, a difference of 0.13%), Paiute (1.5%, a difference of 0.17%), and Immigrants from Trinidad and Tobago (1.5%, a difference of 0.22%).
| Demographics | Rating | Rank | Doctorate Degree |
| Kiowa | 0.5 /100 | #267 | Tragic 1.5% |
| U.S. Virgin Islanders | 0.5 /100 | #268 | Tragic 1.5% |
| Crow | 0.5 /100 | #269 | Tragic 1.5% |
| Salvadorans | 0.5 /100 | #270 | Tragic 1.5% |
| Immigrants | Trinidad and Tobago | 0.5 /100 | #271 | Tragic 1.5% |
| Immigrants | Barbados | 0.4 /100 | #272 | Tragic 1.5% |
| Sioux | 0.4 /100 | #273 | Tragic 1.5% |
| Yaqui | 0.4 /100 | #274 | Tragic 1.5% |
| Aleuts | 0.4 /100 | #275 | Tragic 1.5% |
| Paiute | 0.4 /100 | #276 | Tragic 1.5% |
| Bahamians | 0.4 /100 | #277 | Tragic 1.5% |
| Hawaiians | 0.4 /100 | #278 | Tragic 1.5% |
| Marshallese | 0.4 /100 | #279 | Tragic 1.5% |
| Ecuadorians | 0.4 /100 | #280 | Tragic 1.5% |
| Tohono O'odham | 0.4 /100 | #281 | Tragic 1.5% |
Demographics Similar to Indians (Asian) by Doctorate Degree
In terms of doctorate degree, the demographic groups most similar to Indians (Asian) are Immigrants from Belgium (2.9%, a difference of 0.66%), Immigrants from Sweden (2.9%, a difference of 1.6%), Immigrants from France (2.9%, a difference of 1.7%), Immigrants from Eastern Asia (3.0%, a difference of 1.8%), and Immigrants from India (2.8%, a difference of 2.8%).
| Demographics | Rating | Rank | Doctorate Degree |
| Immigrants | Taiwan | 100.0 /100 | #4 | Exceptional 3.2% |
| Iranians | 100.0 /100 | #5 | Exceptional 3.1% |
| Immigrants | Switzerland | 100.0 /100 | #6 | Exceptional 3.1% |
| Immigrants | China | 100.0 /100 | #7 | Exceptional 3.1% |
| Immigrants | Israel | 100.0 /100 | #8 | Exceptional 3.0% |
| Immigrants | Iran | 100.0 /100 | #9 | Exceptional 3.0% |
| Immigrants | Eastern Asia | 100.0 /100 | #10 | Exceptional 3.0% |
| Indians (Asian) | 100.0 /100 | #11 | Exceptional 2.9% |
| Immigrants | Belgium | 100.0 /100 | #12 | Exceptional 2.9% |
| Immigrants | Sweden | 100.0 /100 | #13 | Exceptional 2.9% |
| Immigrants | France | 100.0 /100 | #14 | Exceptional 2.9% |
| Immigrants | India | 100.0 /100 | #15 | Exceptional 2.8% |
| Eastern Europeans | 100.0 /100 | #16 | Exceptional 2.8% |
| Immigrants | Australia | 100.0 /100 | #17 | Exceptional 2.8% |
| Immigrants | Sri Lanka | 100.0 /100 | #18 | Exceptional 2.8% |